Week 3 - Alpha Chart Pack: Trade setups
The chart pack contains super charged technical analysis of at least 4 stocks. Based on these technical setups you can choose either to buy the stock or trade options. One thing to remember is these setups would only be for short term (max 4 weeks) and might not be used to make trade after one week.
This alpha chart pack contains super charged technical analysis of at least 4 stocks.
Based on these technical setups you can choose either to buy the stock or trade options. One thing to remember is these setups would only be for short term (max 4 weeks) and might not be used to make trade after one week.
The technical analysis is purely based on chart, that means fundamentals of a company for these trade setups will not be considered.
For eg, if we are long $TSLA in our Portfolios or it fundamentally looks very strong, but based on chart we can short $TSLA using options for few weeks.
Note: Contact us by responding to this email or follow us on Twitter in case of any questions.
 Admin
Admin
Keep strict stop loss, if position is in profit raise your stop loss to the buying price.
Following are the trade setups.
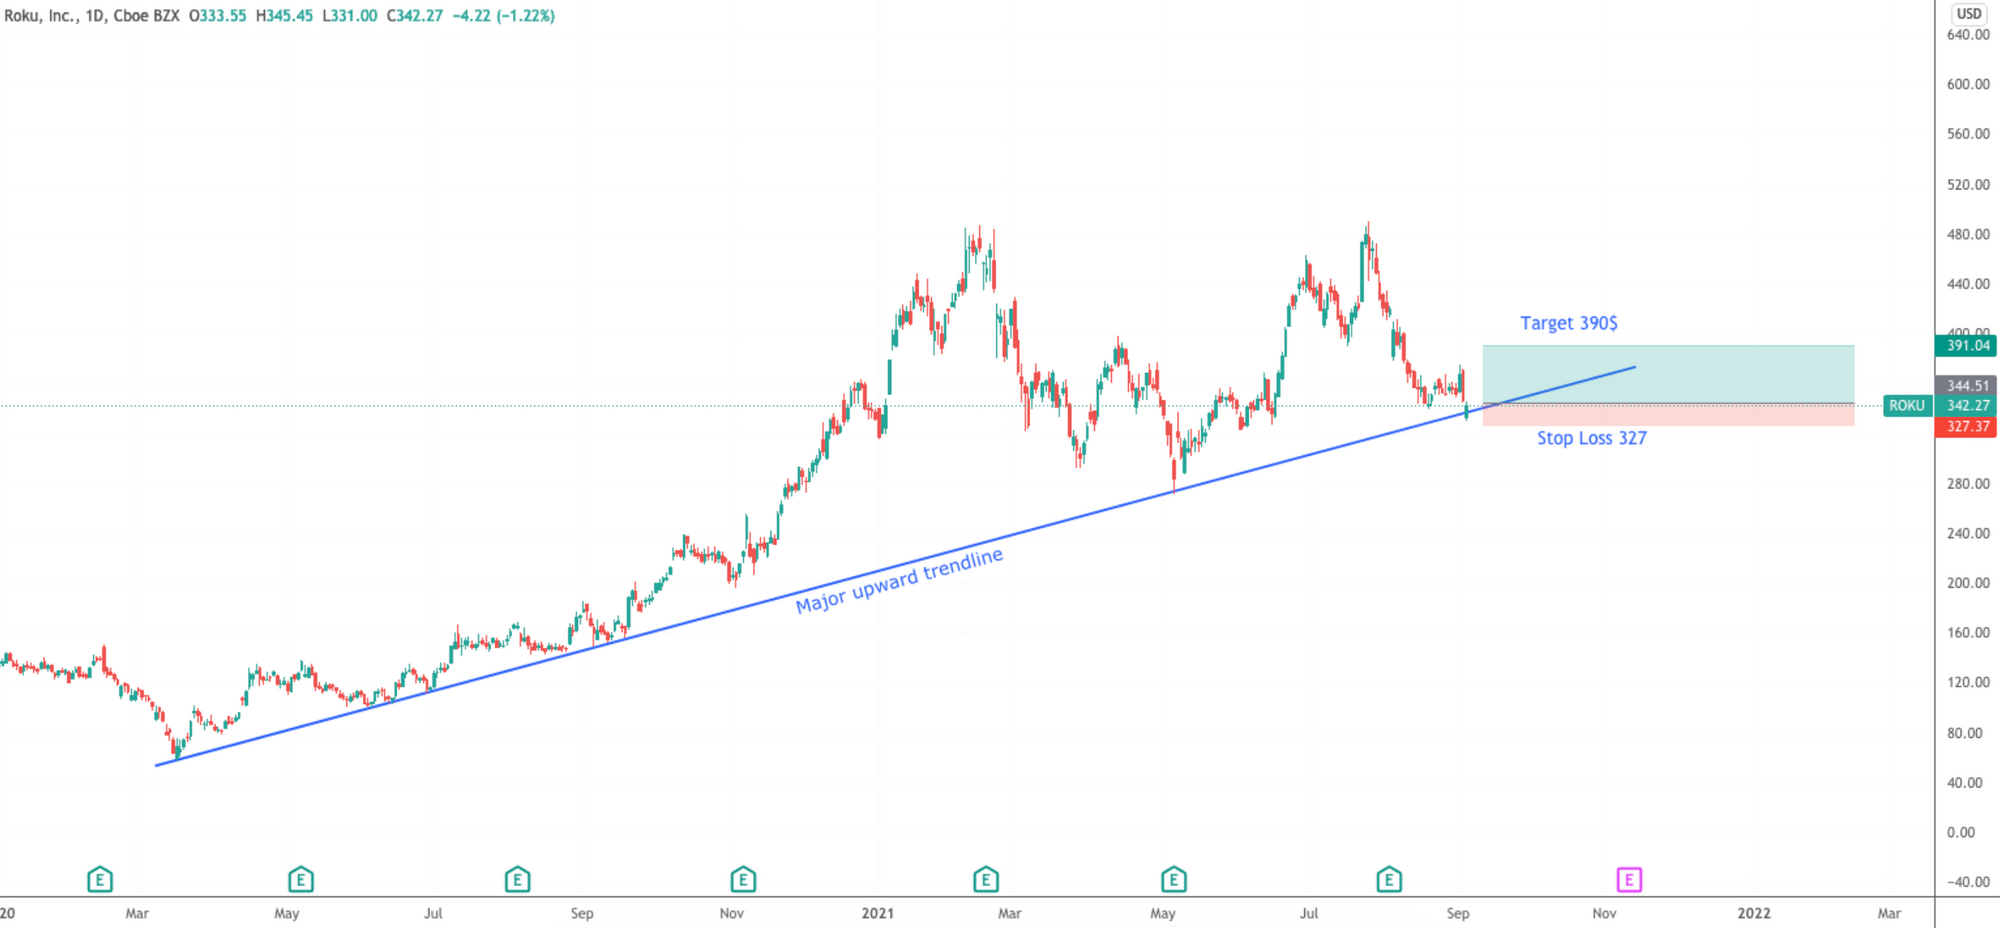
Long $ROKU - Target $390, Stop Loss $327
We had ROKU in our week 1 chart pack as well, but ROKU still looks to make a rebound from here.
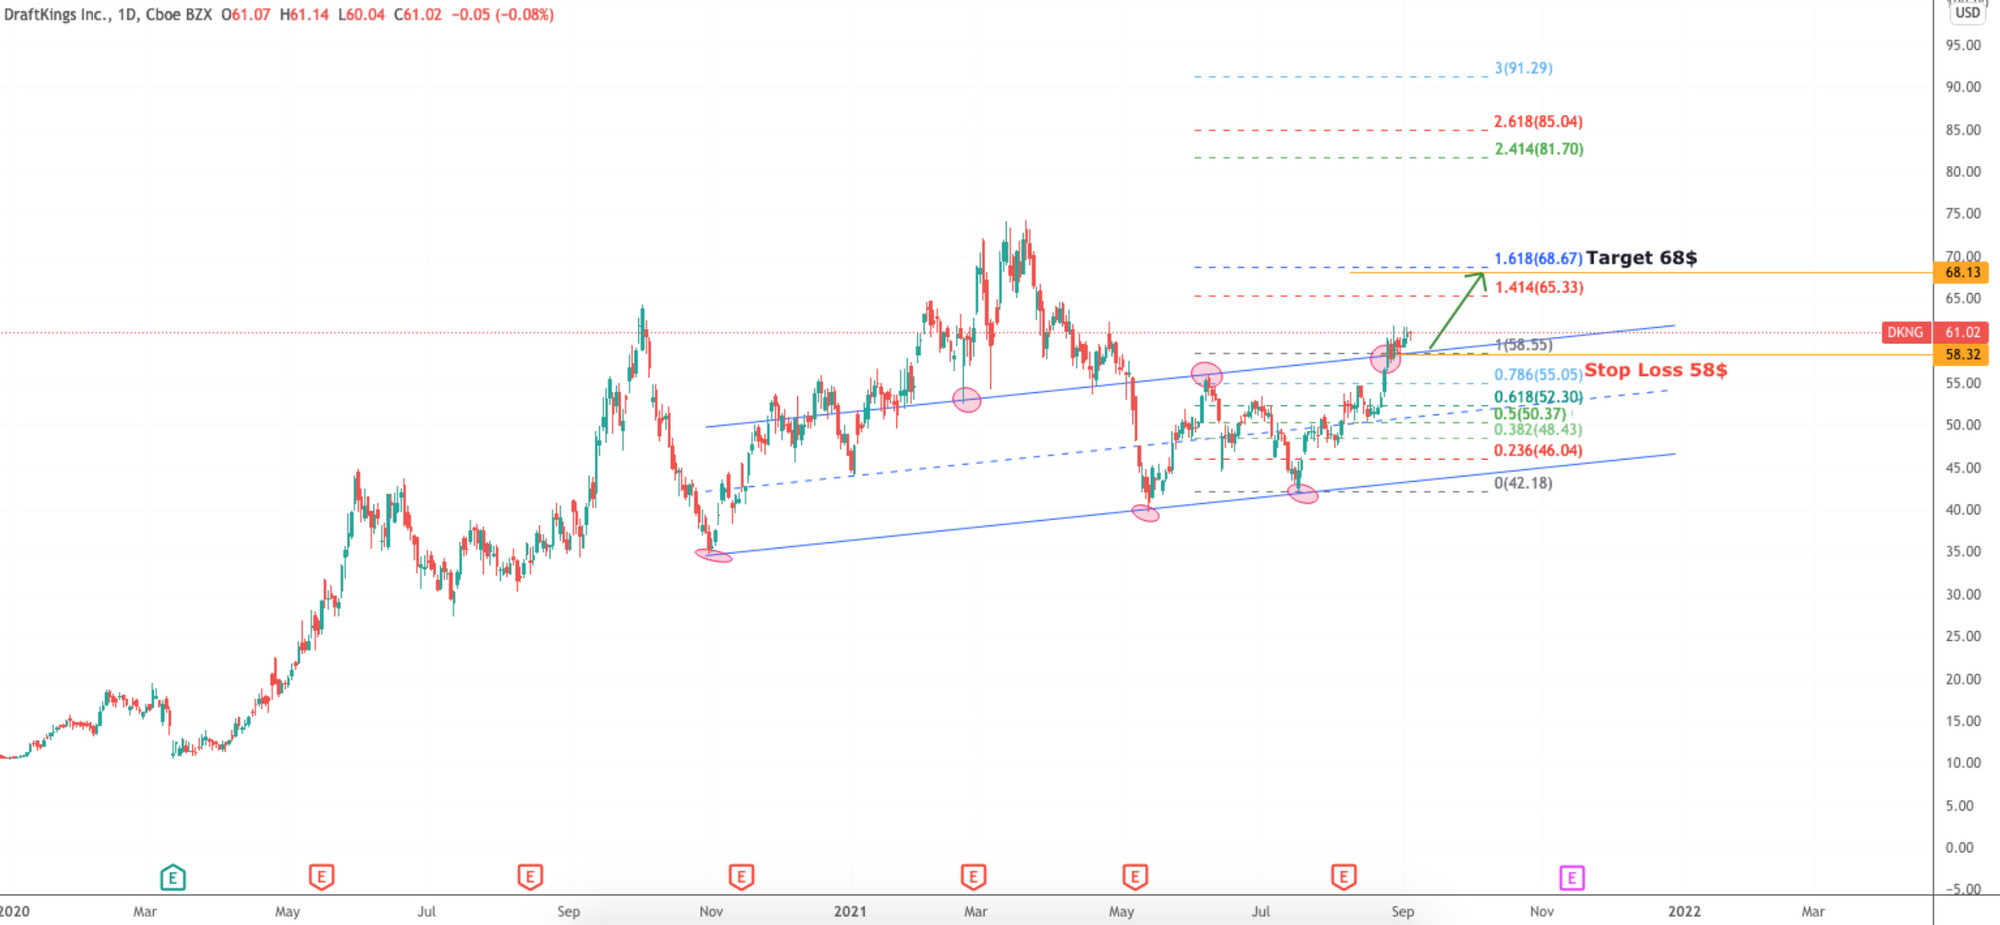
Long $DKNG - Target $68, Stop Loss $58
DKNG has a nice consolidation since couple of months but it moved strictly between these two blue lines. Now breaking out from the channel and we could see a rally here. We hold DKNG in our long term portfolio 2021.
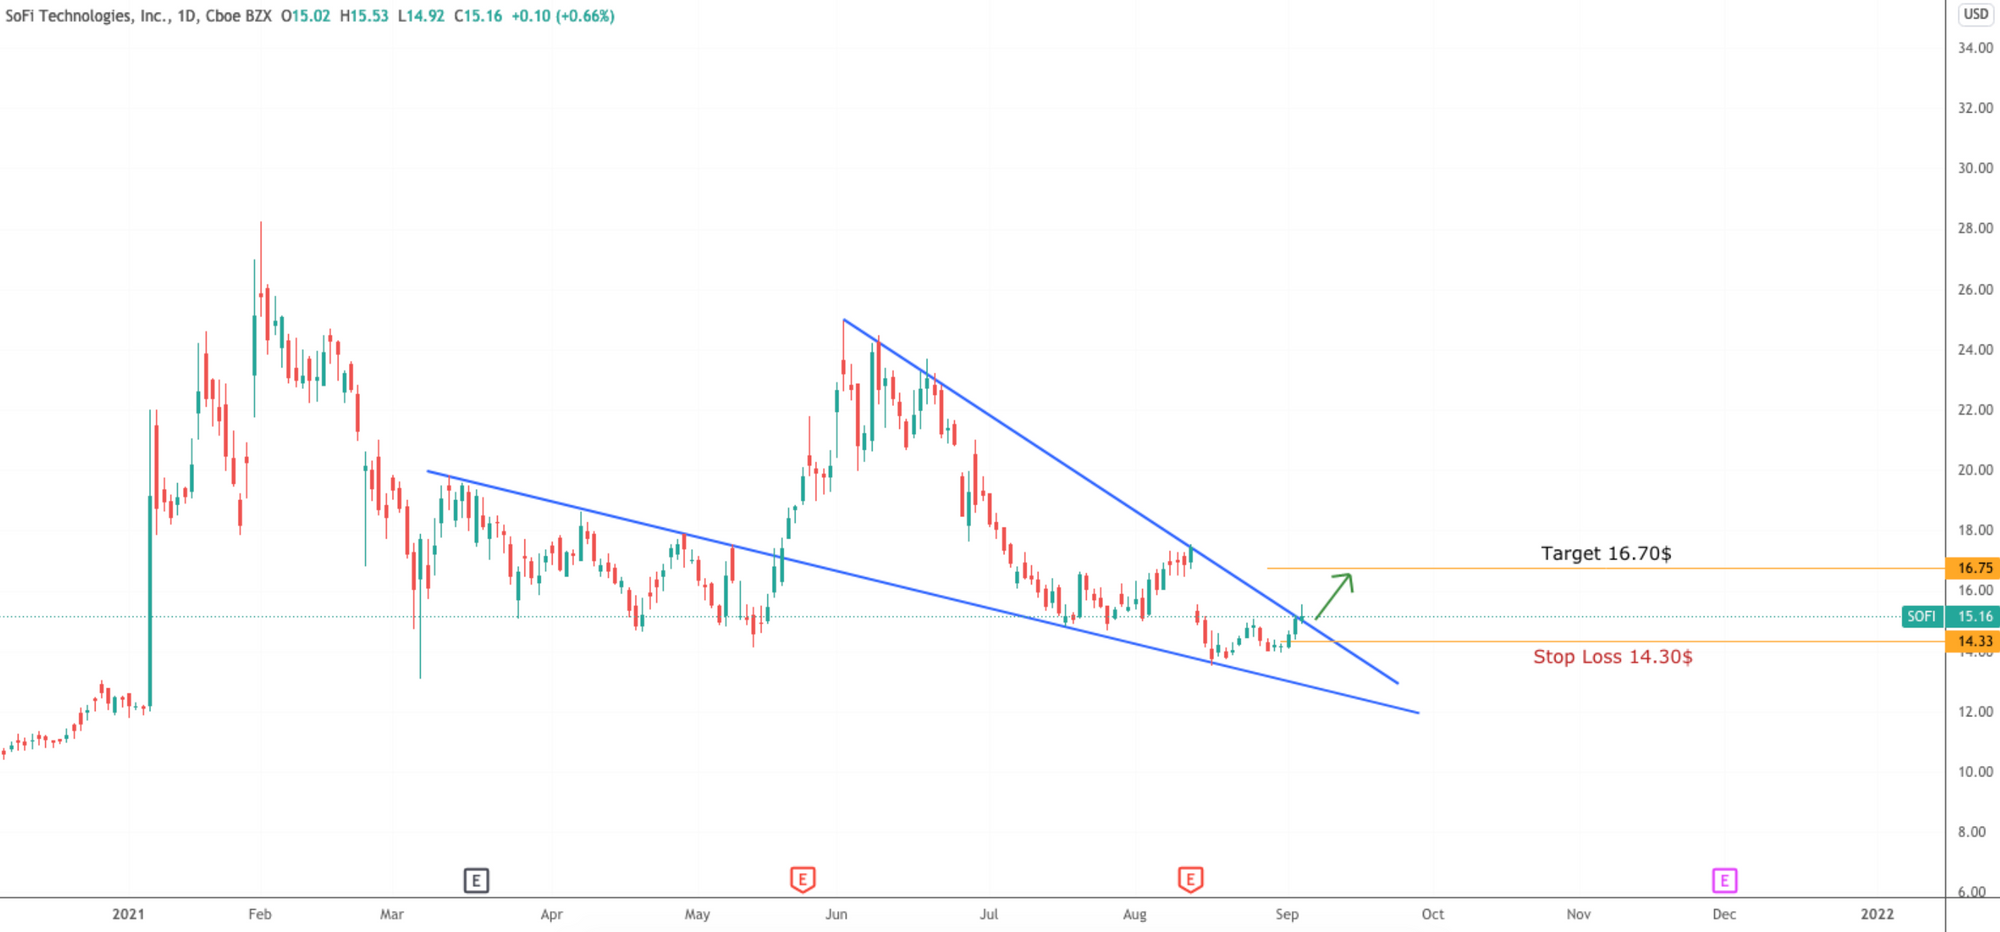
Long $SOFI - Target $16.70, Stop Loss $14.30
Expect SOFI to make some decent move from here. If it couldn't close this week strong then expect some more consolidation, so keep your stop loss strict. But if it clearly breakout from the wedge we can see a rally.
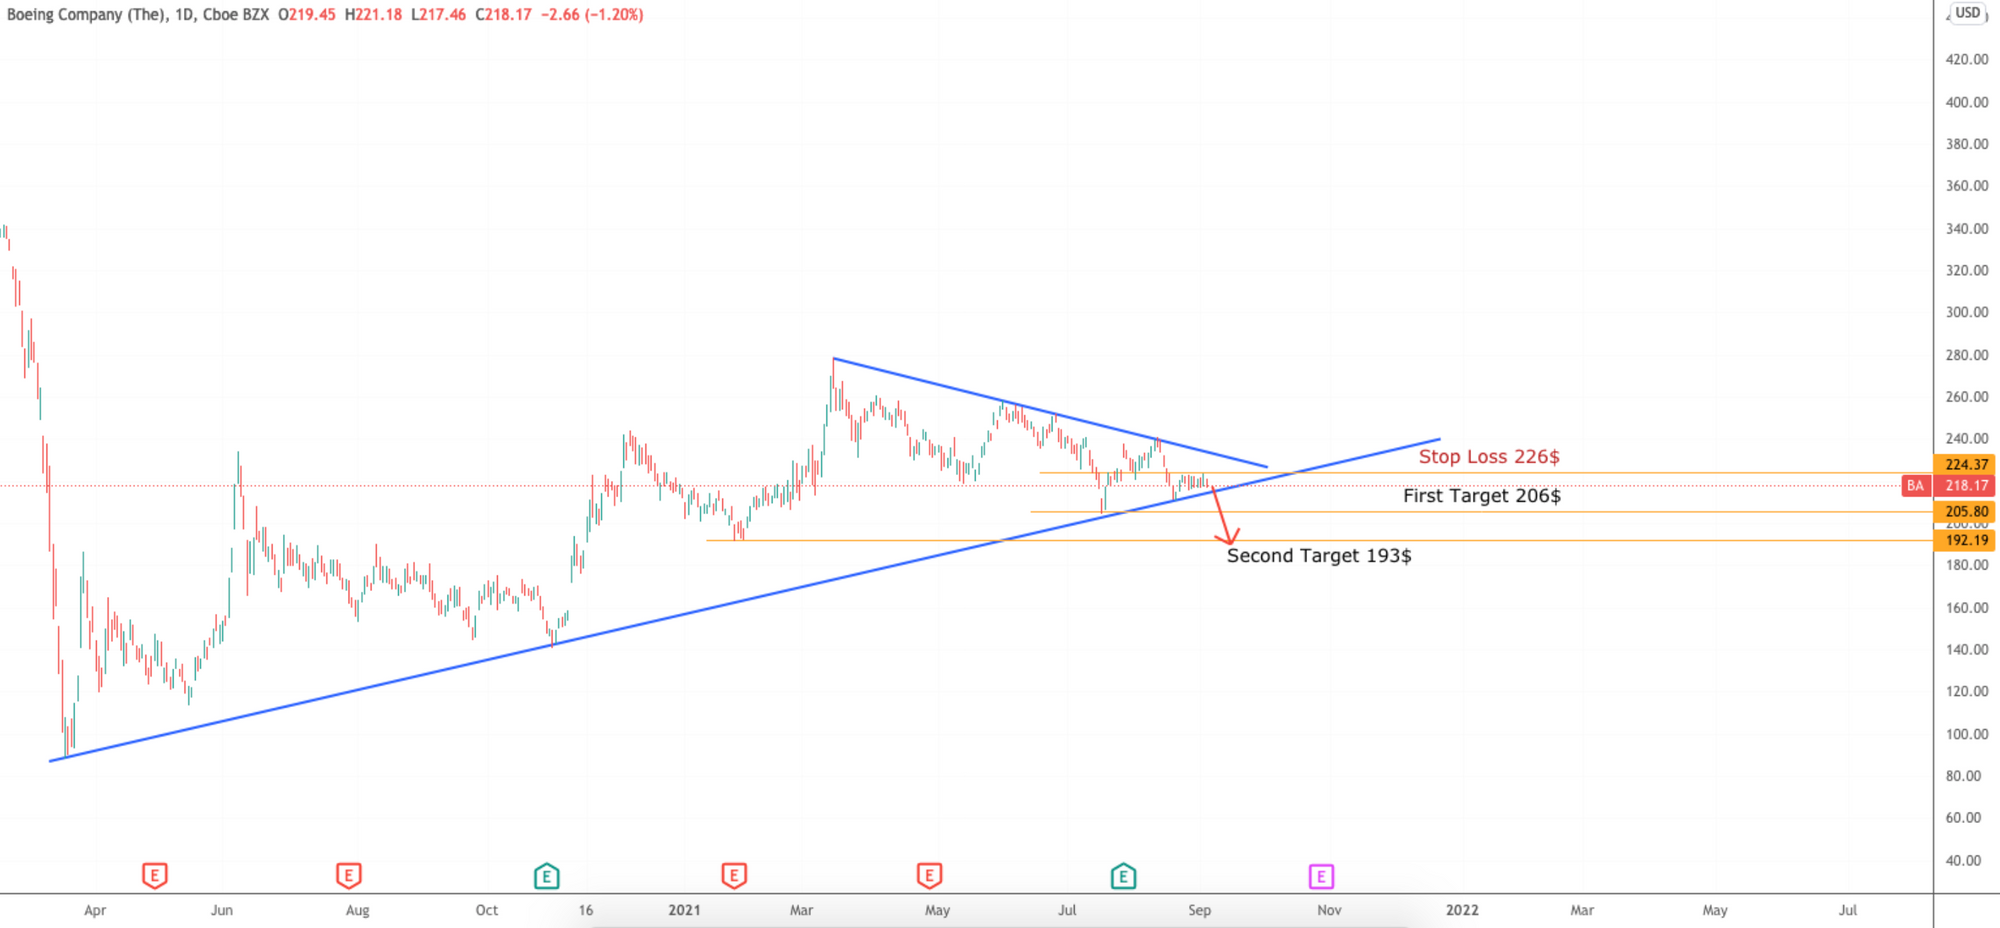
Short $BA - Target $206, Stop Loss $226
It's trying to break the major support line to the downside.
From Week 1 setups:
DIS is still looking promising here. That trade is still valid. We sent a option call alert last week for Disney and booked 100% profit.
Alpha StaffPlease appreciate us on Twitter if you like the technical analysis
Or Email us by responding to this email and follow us on Twitter.
FAQ
What is technical analysis?
In finance, technical analysis is a security analysis methodology for forecasting the direction of prices through the study of past market data(statistics), primarily price and volume. Technical analysts use charts to determine what’s likely to happen next with the price movement.
What is Swing Trading?
Swing Trading is a method of trading that attempts to capture gains within a period of 2-10 days. Generally, it’s easier and less risky than day trading. It requires less time and is suitable for traders who can’t devote themselves to watching the market. As swing trading aims to capture larger price moves than day trading, profitability can be higher.
What is Day Trading?
Day trading is a method of trading in which individuals buy and sell shares over a period of a single trading day. The intention is to profit from small price fluctuations. There are advantages such as less time risk, faster realization of profit, and no overnight holding risk. Disadvantages to day trading are the time and attention it requires one to devote during market hours, an increased frequency of trades and thus fees, smaller price moves mean spreads between the bid and ask price have a higher impact on profits and increased trader stress. Generally, it’s one of the toughest ways to profit from trading, and it demands extreme discipline. In short, it’s not for everyone.
What is a Trading System?
A Trading System is a complete set of rules which define how to enter, exit and manage risk while trading financial instruments. Using a clear set of rules eliminates the emotion in trading decisions: one of the roadblocks to successful trading. It can also save time by applying the same trading plan to multiple trades.
What does “Long” and “Short” mean in trading?
You have two ways to trade a stock. When one makes a long trade, one is purchasing shares in anticipation of them increasing in value to sell them later for a profit. When one makes a short trade or sells something short, one borrows the shares and sells them on the stock market in anticipation of the stock price falling. This provides the short seller the opportunity to buy the shares back at a lower price, therefore profiting from the difference.
What does a “Bull“ and “Bear“ mean in the stock market?
In a bull market, there is an assumption that stocks will continue to rise in price, while in a bear market, the assumption is that stocks will fall in price.
What is the Pattern Day Trade Rule? (PDT)
Per FINRA, the term “Pattern Day Trader” means any customer who executes 4 or more day trades within a rolling 5 business-day period, using a margin trading account. A pattern day trader’s account must maintain minimum equity of $25,000 at the start of any day on which day trading occurs. Pattern day-trader accounts that fall below the $25,000 minimum equity requirement will not be allowed to day trade. If a day trade is executed when the equity is below $25,000, the account will be restricted to closing transactions only for 90 days, or until the equity is brought up to $25,000.
-Alpha Staff