Week 1: Stage analysis top picks
This alert contains list of stocks showing relative strength and attempting Stage 2 breakout.
Note: These are not the stocks that we are adding in our Portfolio 2023, You will get separate email next week where we add our first 10 stocks.
Never Buy a stock in Stage 4
What is Stage Analysis?
In technical chart analysis, stage analysis refers to the use of charts and other technical indicators to identify the stage that a security (such as a stock, bond, or currency) is in within its overall trend. This can help traders and investors make informed decisions about whether to buy, sell, or hold the security.
There are generally four stages in the trend of a security: accumulation, markup, distribution, and markdown.
During the accumulation stage, the security is being quietly bought by long-term investors and institutions, and the price may appear to be moving sideways or drifting lower. We call it Stage 1.
In the markup stage, the security begins to gain attention and the price starts to rise as more buyers enter the market. We call it Stage 2.
During the distribution stage, the security is being sold by these long-term investors and institutions, and the price starts to drift lower or move sideways. We call it Stage 3
Finally, in the markdown stage, the security is being aggressively sold by these investors, and the price begins to fall sharply. We call it Stage 4
By identifying the stage that a security is in, technical analysts can make informed decisions about whether to buy, sell, or hold the security based on the expected future direction of the price.
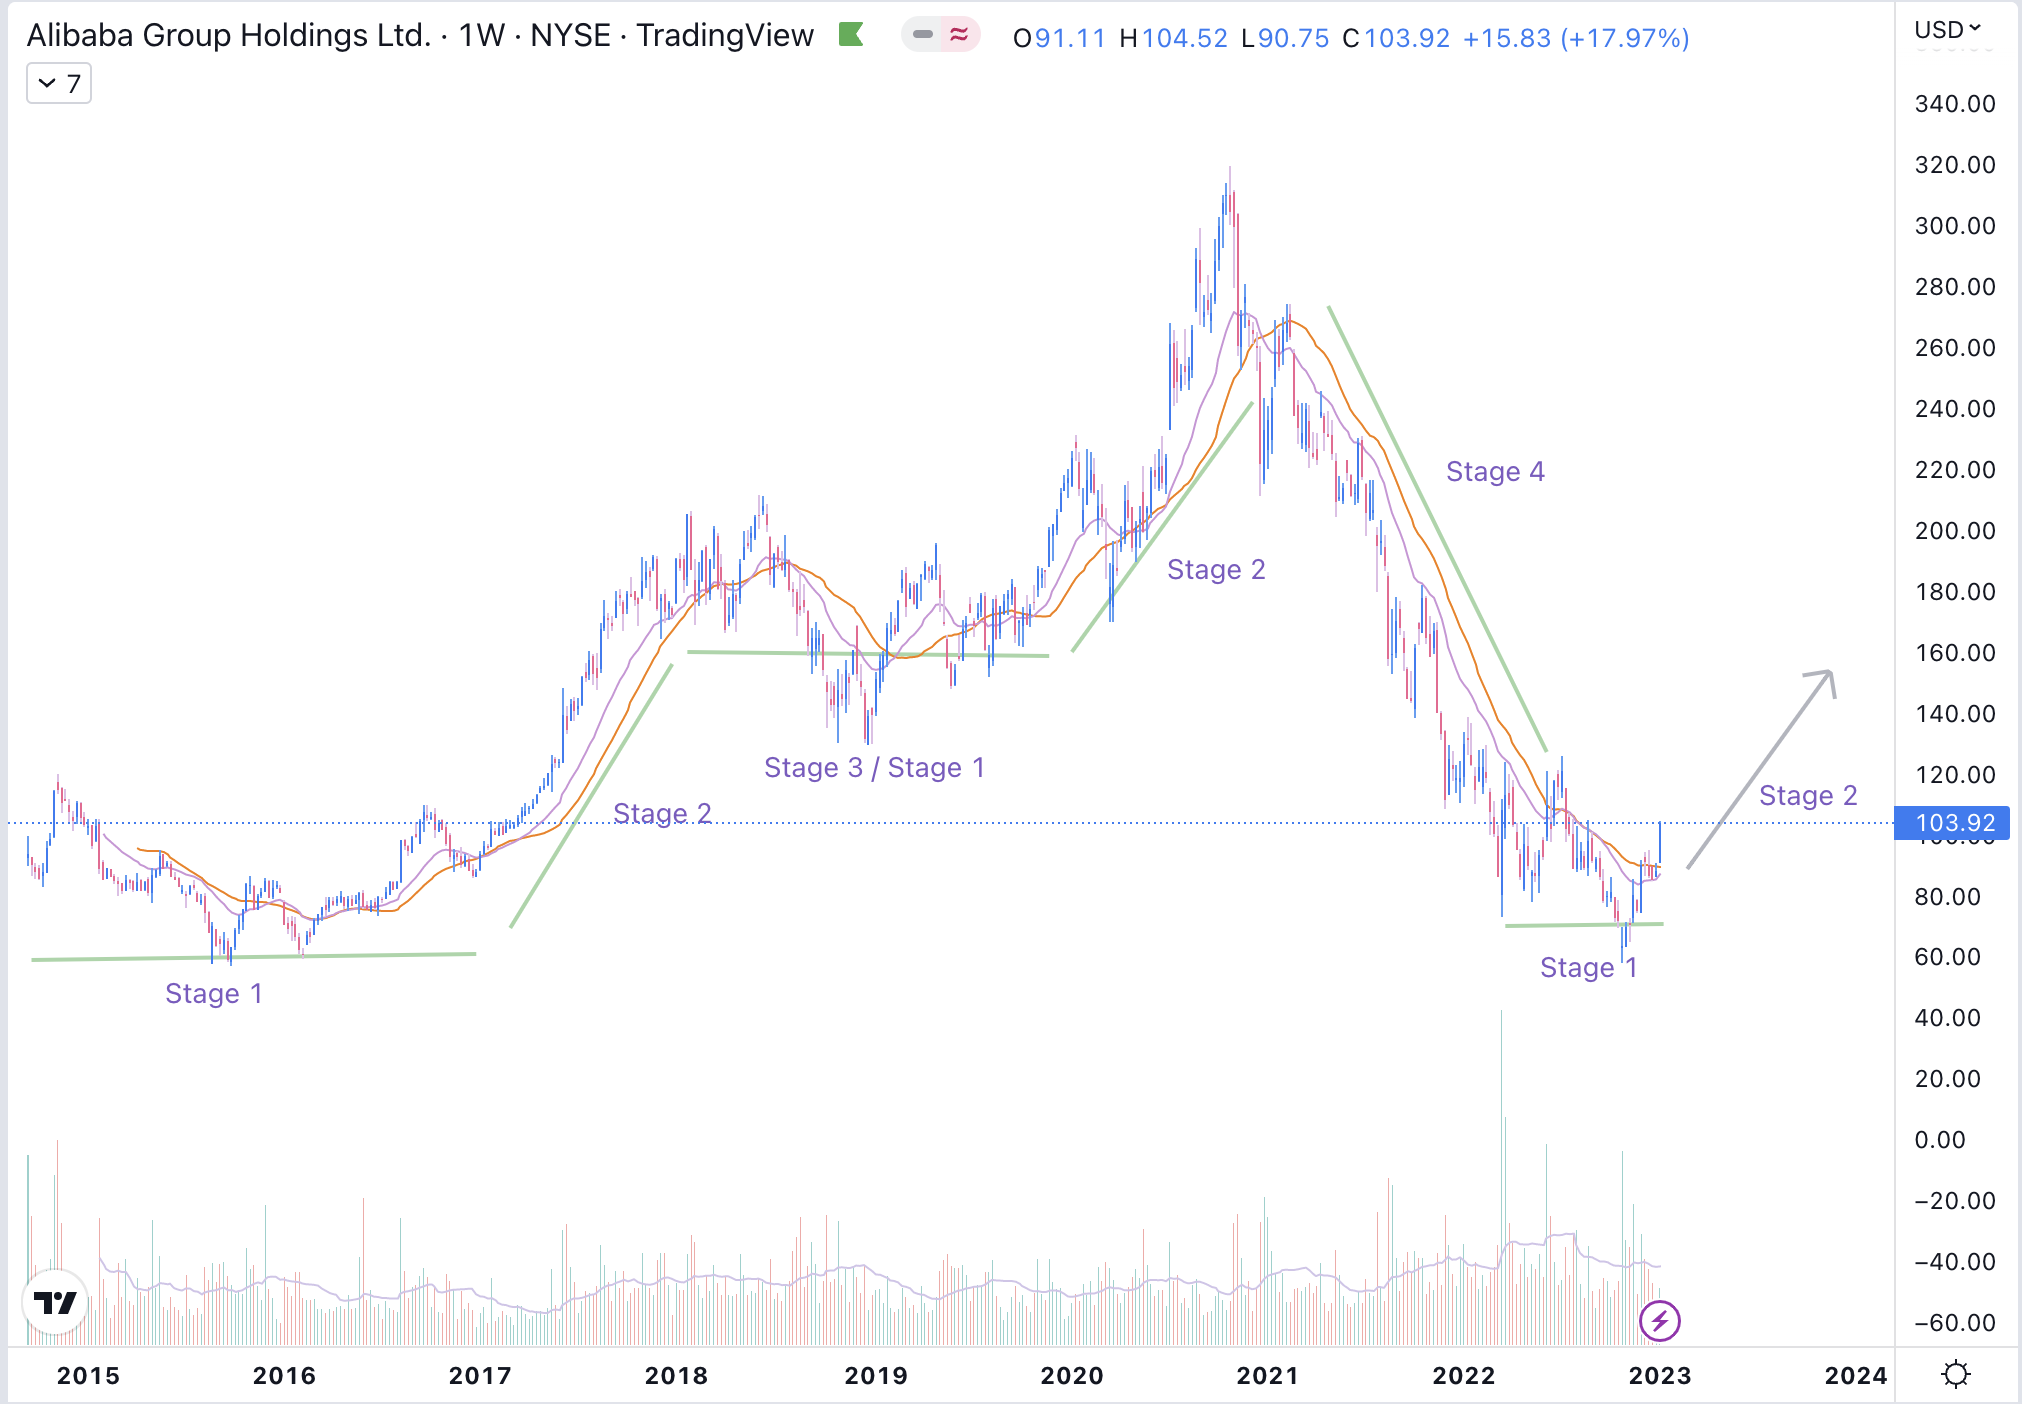
For Example: BABA since IPO
BABA has seen all the stages from accumulation phase to markup phase and recent markdown phase (Stage 4).
Top picks of the month that are attempting Stage 2 breakout.
Pinduoduo Inc : Long PDD above $78
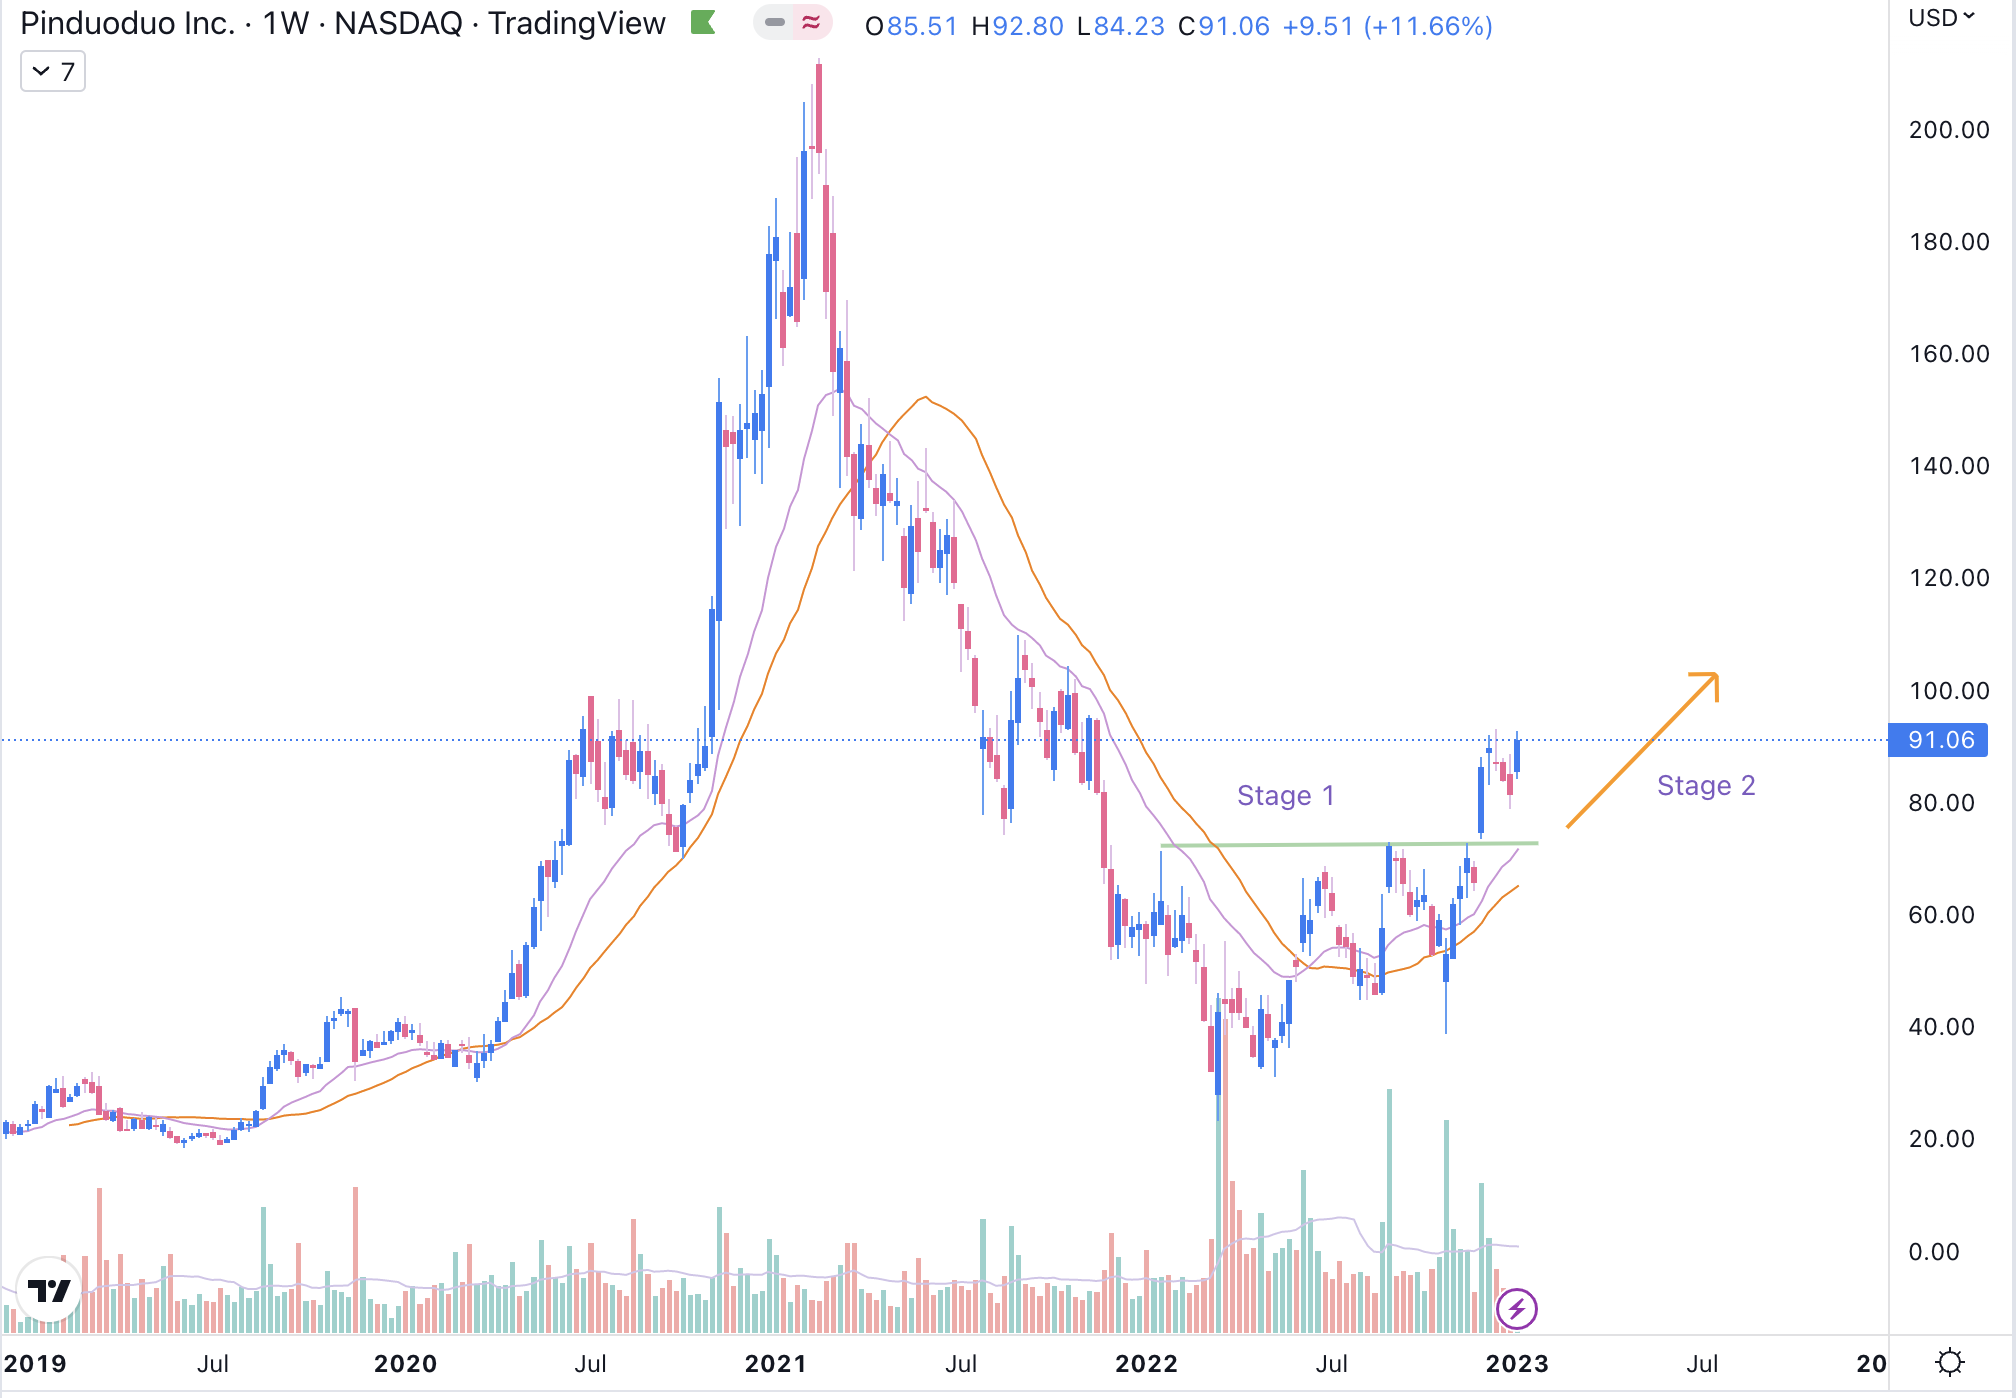
PDD can attempt to continue higher from here, or may retrace back to support at Stage 1 breakout resistance (around $78), which is now a support for Stage 2.
Shopify Inc: Long SHOP above $30
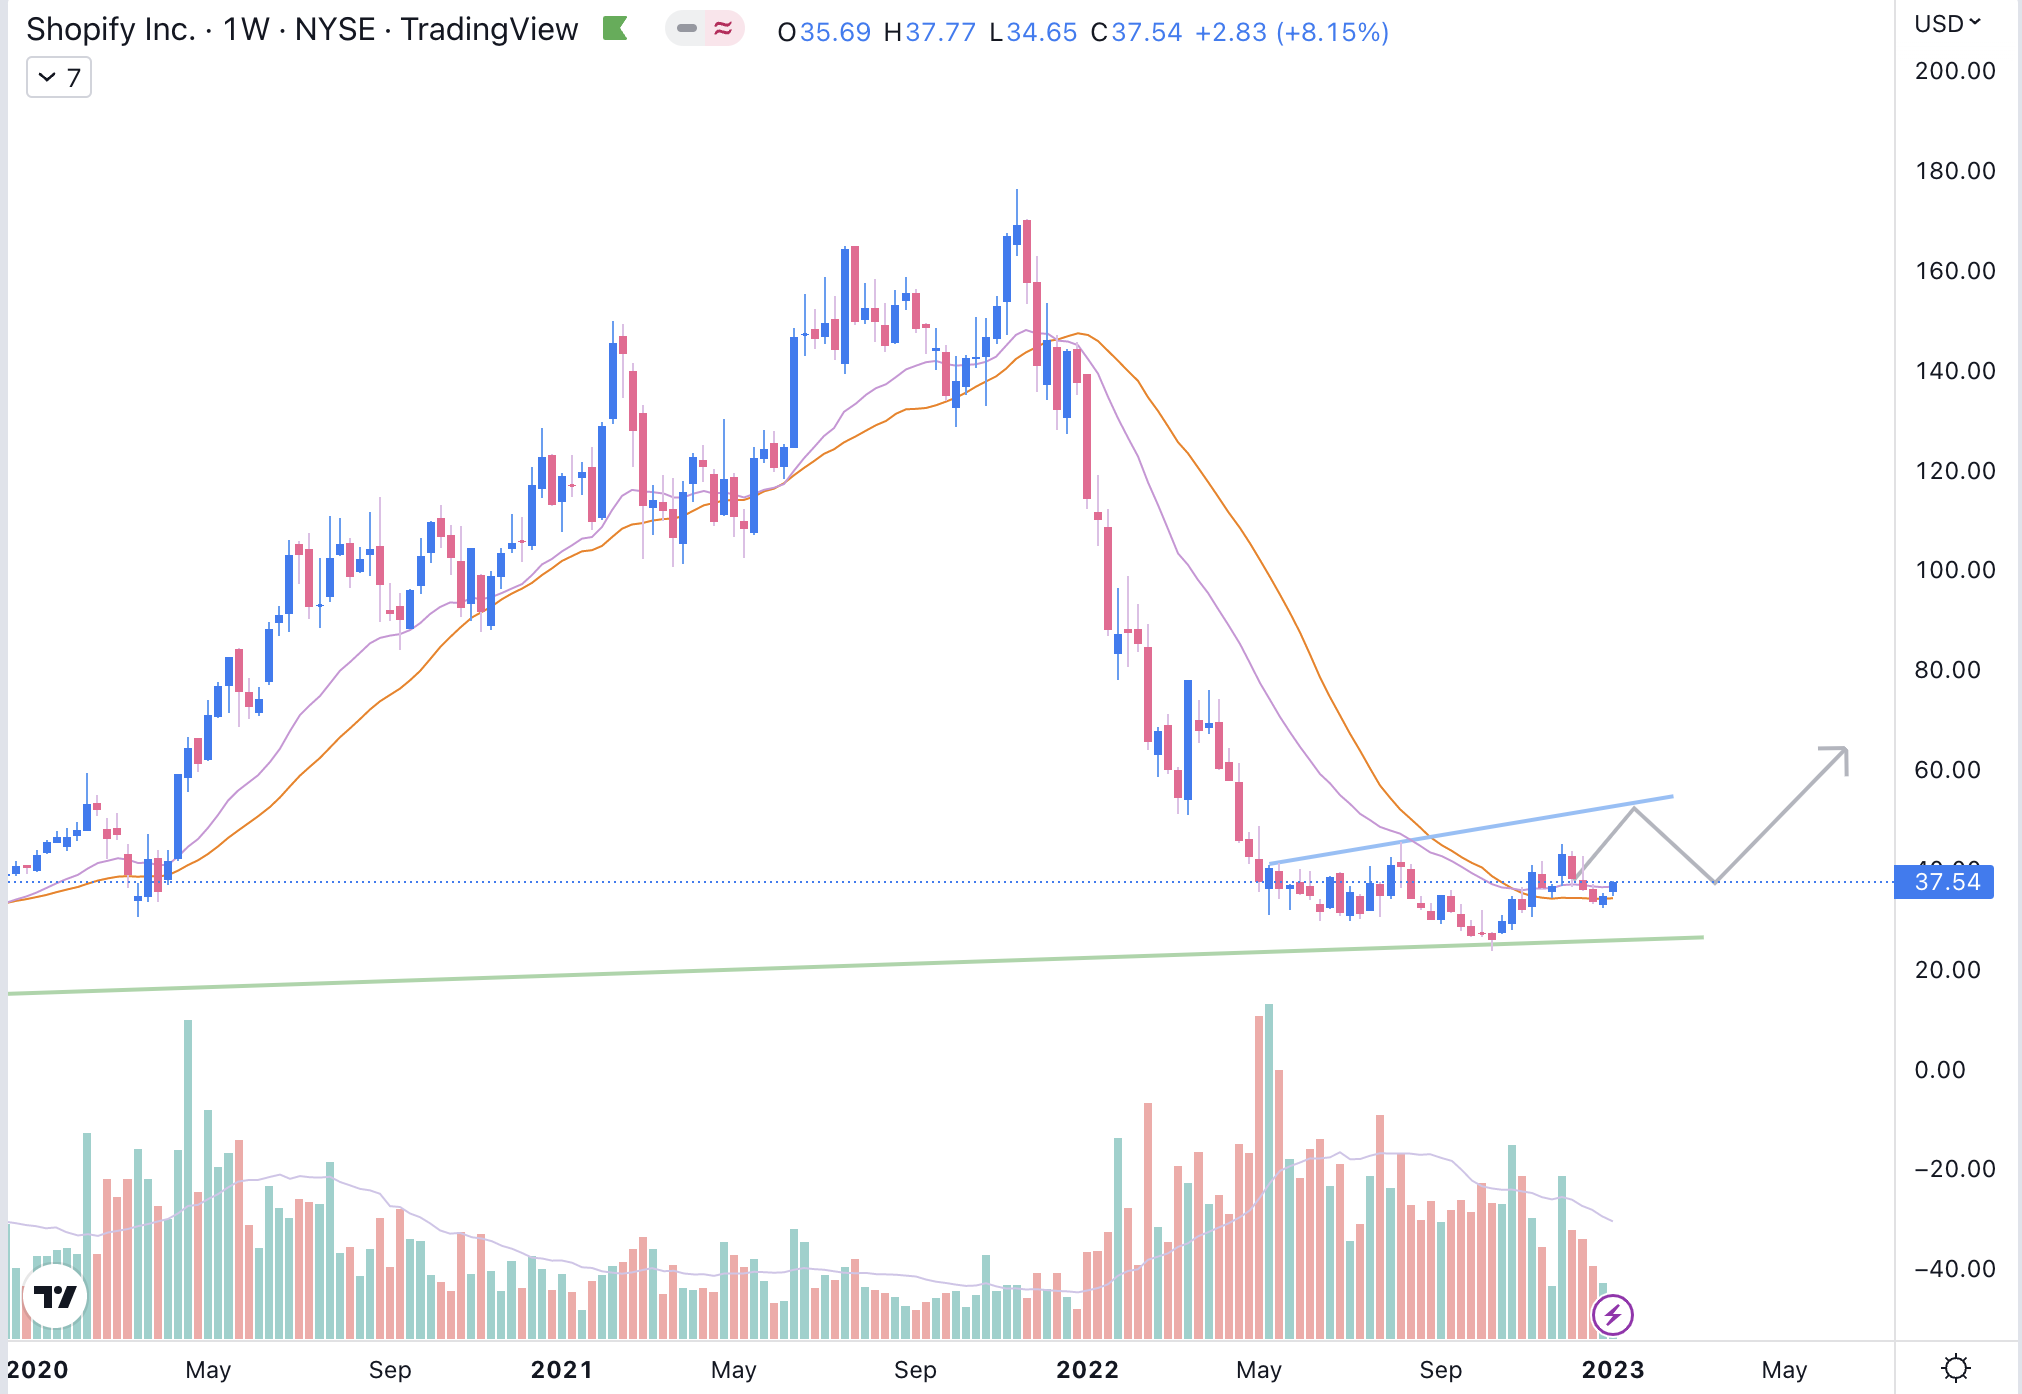
Based on above chart Shop is forming a base and trading above 30 Week moving average, it has yet to breakout from Stage 1 resistance at $45
Toast Inc : Long TOST above $18
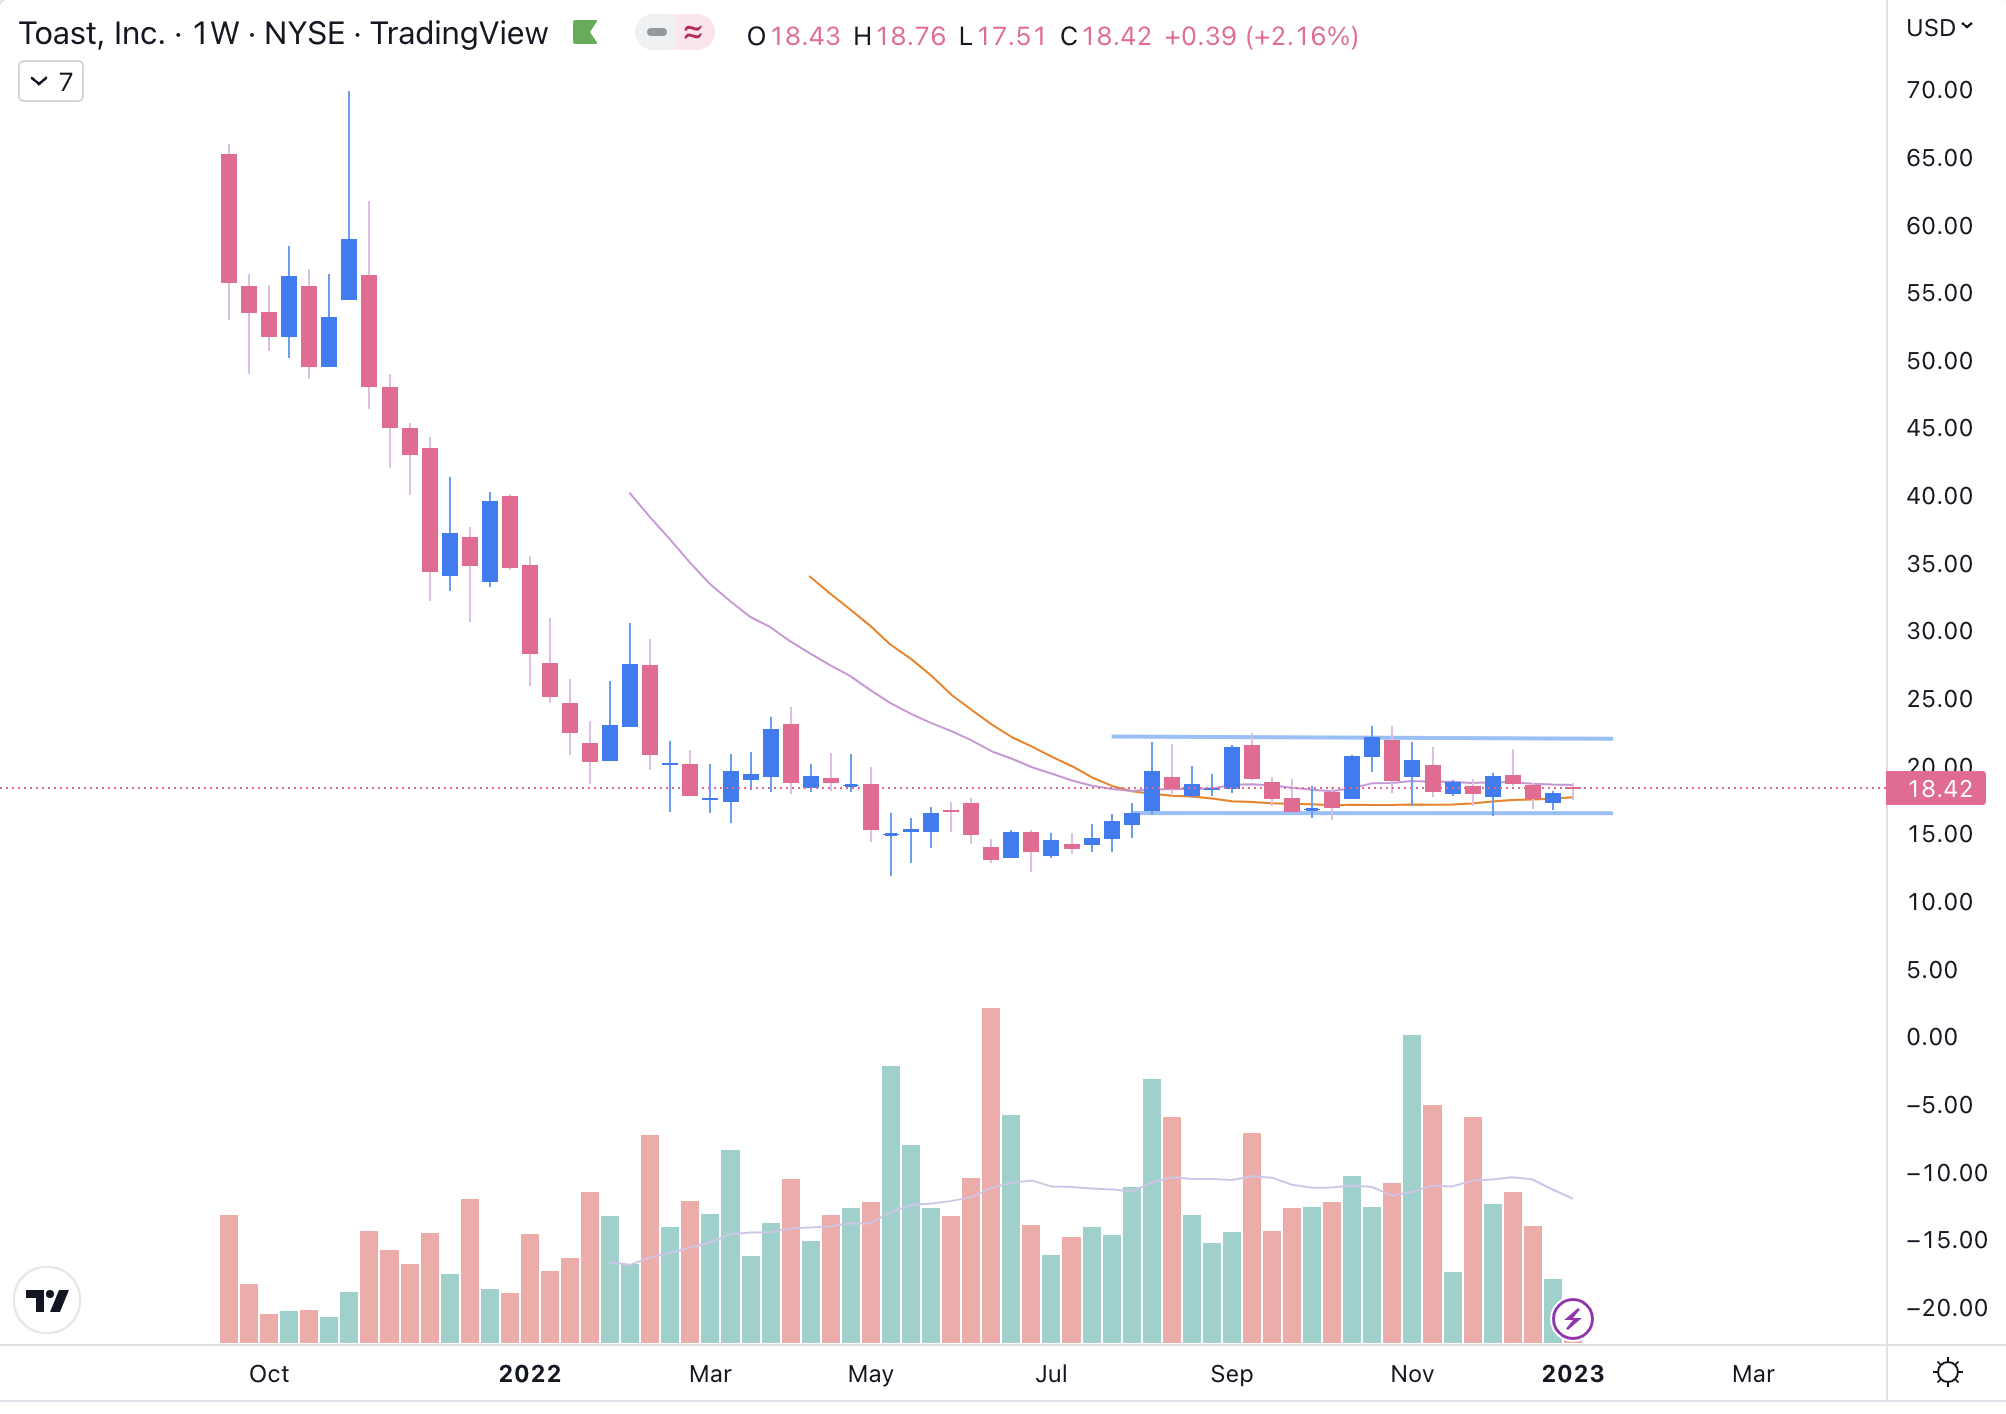
Toast is at crucial stage, if it breaks below $18 and stayed there for couple of weeks. It can resume Stage 4 decline
Hims and Hers Health Inc : Long HIMS above $5.70
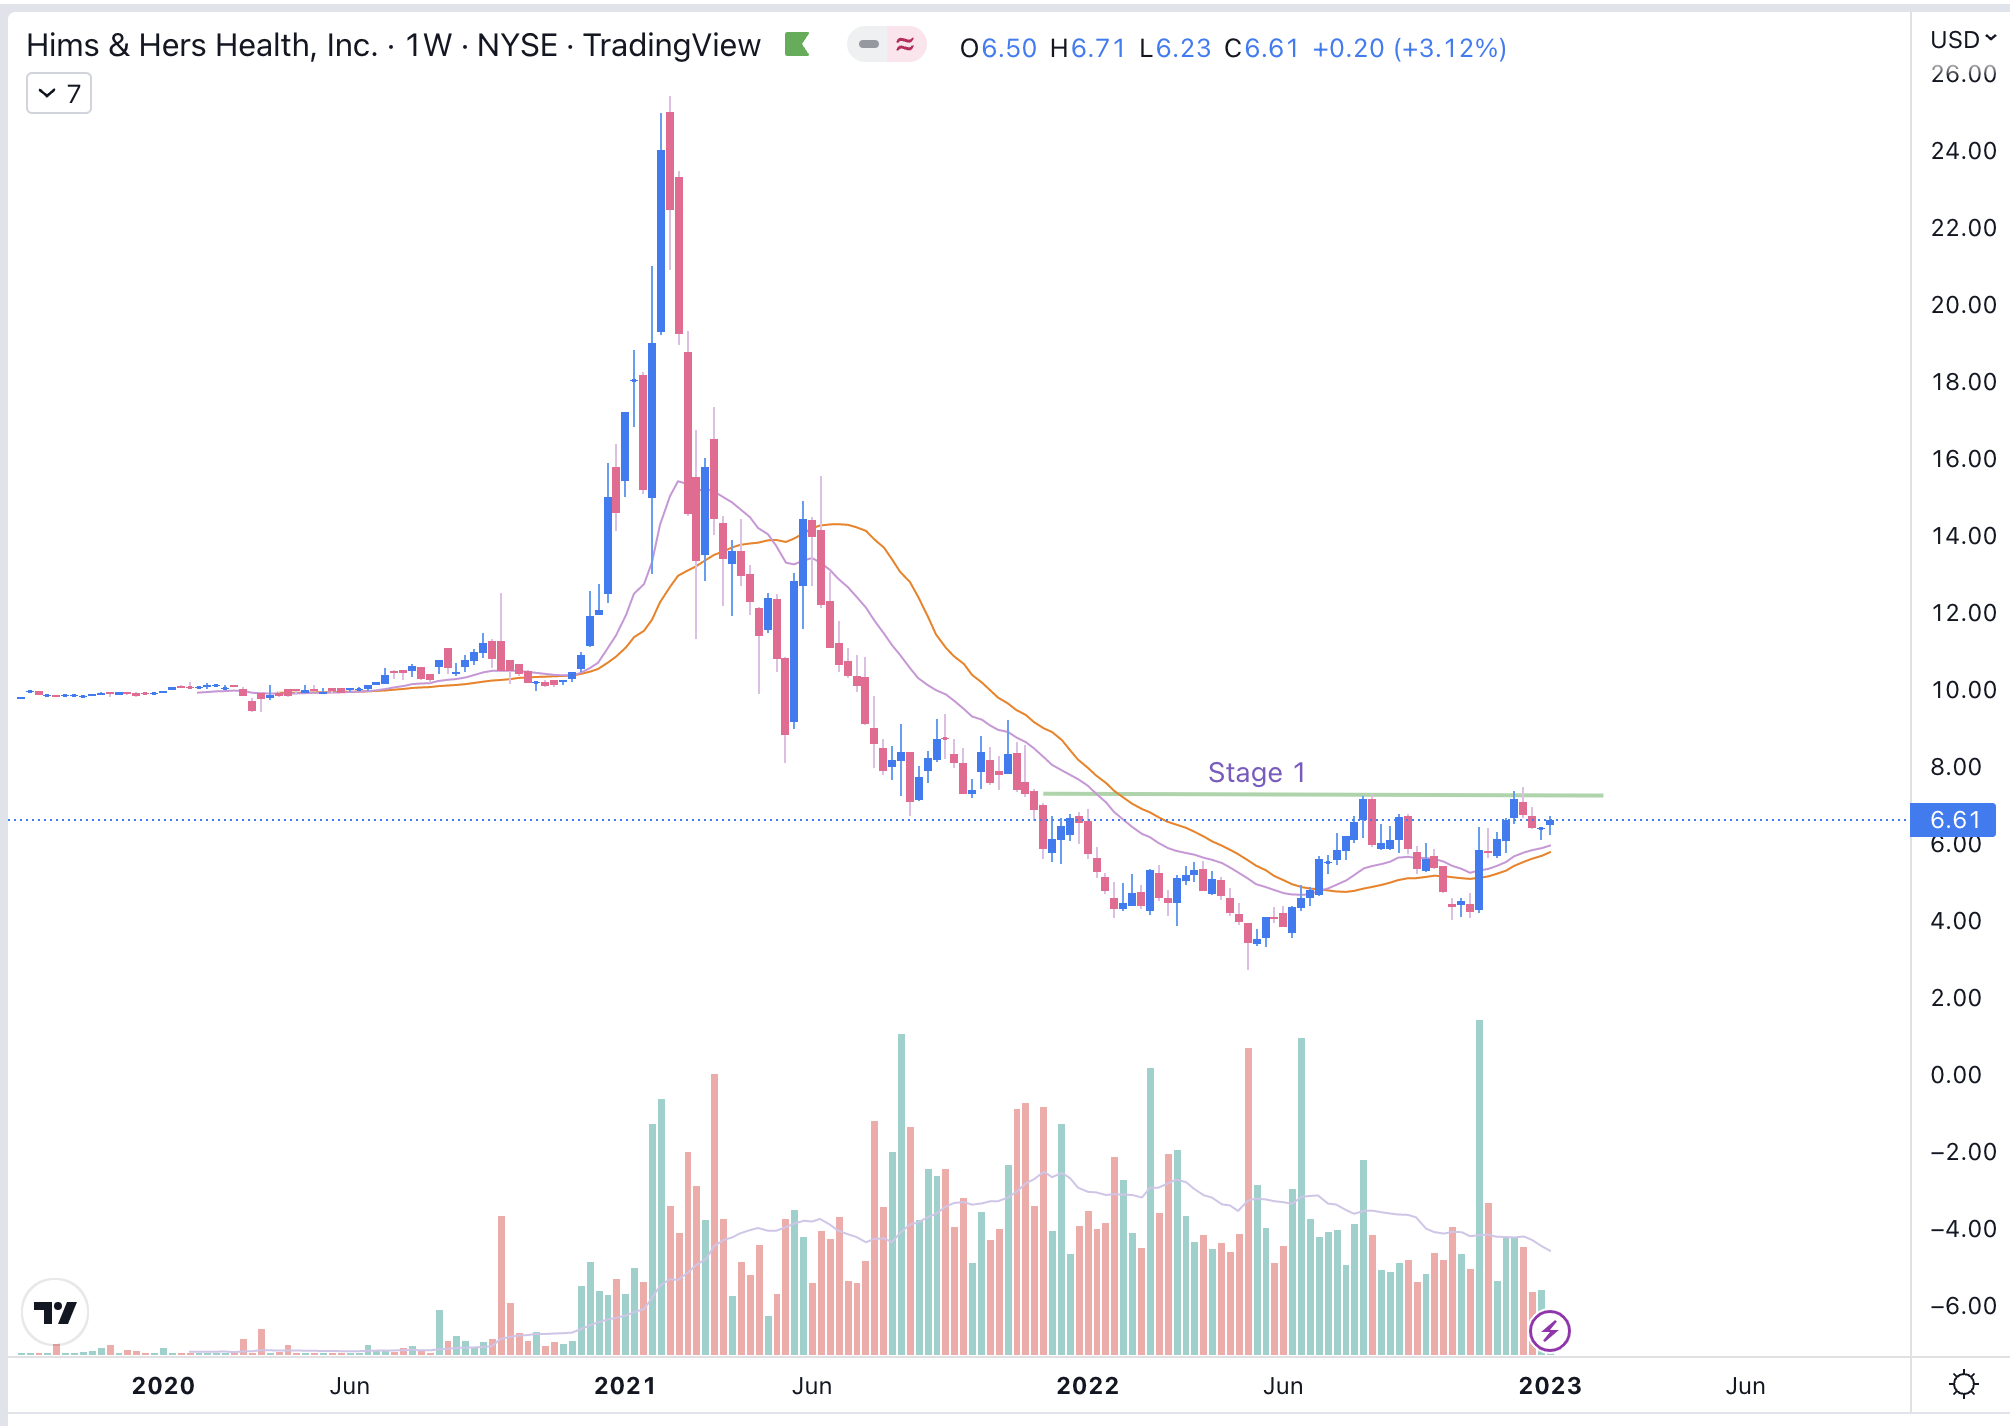
Hims is in Stage 1 and forming a base, while it's previous attempt to break out failed but it made 2nd attempt and failed, but continue trade above 30 week moving average.
If it break the green resistance line of Stage 1, we can see HIMs at $10
Note: These are not the stocks that we are adding in our Portfolio 2023, You will get separate email next week where we add our first 10 stocks.
-Alpha Staff