Portfolio 2023: QQQ Update
Market Update
Stocks could have a good and strong first half of the year, though the risk of recession still looming. Watch for opportunities in high quality undervalued stocks.
Our Portfolio 2023 set to a good start. Out of 9 stocks we added in Jan, only 1 is in red as of today. Although let's not get too carried away, recession in 2023 is still looming and this delight in the market sentiment can change easily.
How do we track this sentiment change?
In past we tracked few indicators, that tells us when we should buy and when we should start booking profits. Keep in mind, we are long term investors and our vision is to hold the stocks that we add to our portfolio for next 10 years. But we would also be vigilant about preserving our gains and capital.
This is what we wrote in the Apr 2022 market update.
"This year remained tough for long term investors, specially if you are a growth & tech investor. Not just that, SPY and Nasdaq are down 10% and 18% year to date too. Our Portfolio 2022 is down 9% as of today."
"Like a broken record i keep insisting on having a longer term perspective, think like a VC, who invest and keep tab on company fundamentals and growth quarter after quarter. Believe in the companies you hold and always remember why you bought them initially. Also build position gradually over many quarters, instead of dumping all of your money at once. This is a bear market and you will get more opportunities to buy best companies at attractive levels."
Netflix is down nearly 70% year to date (in Apr 2022)
This is a great example to read about and being a long term investor and continue to hold best and growing companies. This is not the first time NFLX had such a major draw-down. It has happened in 2004, when it dropped almost 75% and then between 2011-2012 when it dropped 80%. But it came back.
If management and leaders are visionary, led by founders, growing at scale and well run, such companies tend to come back.
See where the NFLX is trading now at $364, more than 100% up since the article.
My point is, never let go your shares of good quality companies.
QQQ Outlook:
Okay, It's time to visualize broader QQQ index
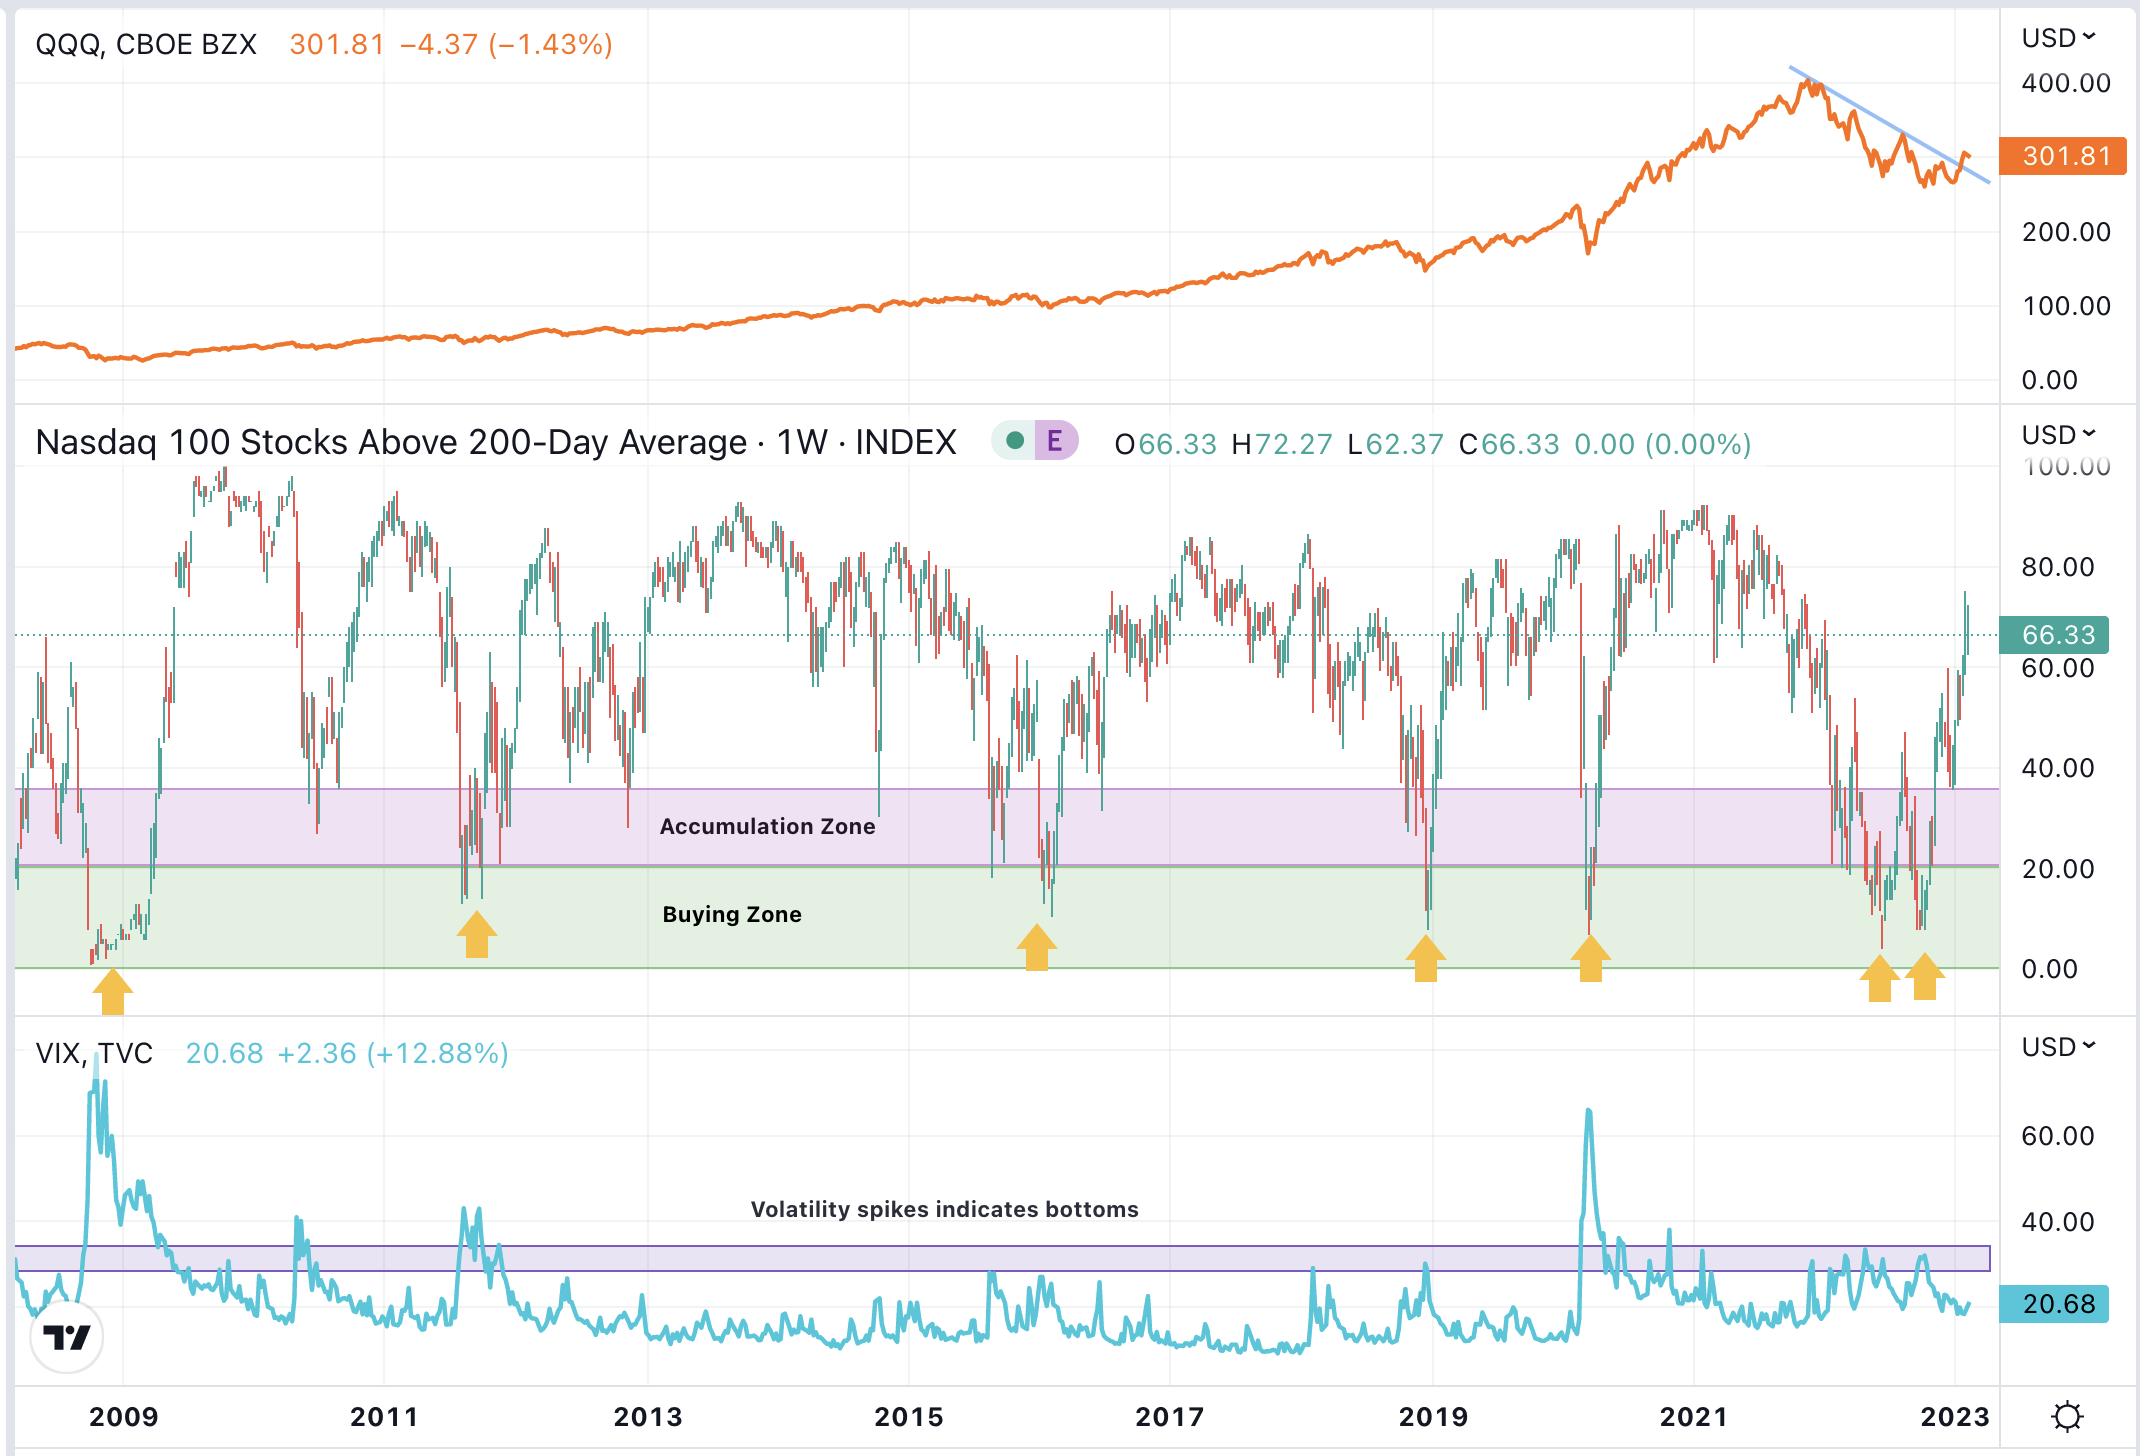
In above chart:
Panel 1 shows QQQ index
Panel 2 shows Nasdaq % of stocks above 200 DMA
Panel 3 shows VIX, volatility in the market
As you can see in this weekly chart, it's an accumulation zone when % of stocks above 200DMA are down to below 40. That has happened only handful of times in last 15 years. If it goes below 20, it's a Buying Zone during a bear market.
Currently the percentage of stocks above their 200 day moving average is around 66%, that is still well below 80. 80% is where Nasdaq would get overbought and we can consider trimming some of our position and book 20% of profits.
Always keep a tab on above chart.
Financial indicator we should keep on watch, to figure out if financial conditions are getting tighter or loosening.
- US Dollar
- U.S. government bonds
- Interest rates
- Fed Policy
If US Dollar, Interest rates, US10Y yield are rising and Bonds are tumbling then stocks/equites won't do good.
Lower US Dollar, Interest rates and US10Y is good for stocks and bonds.
Currently US Dollar index DXY is attempting a breakout above it's downtrending resistance
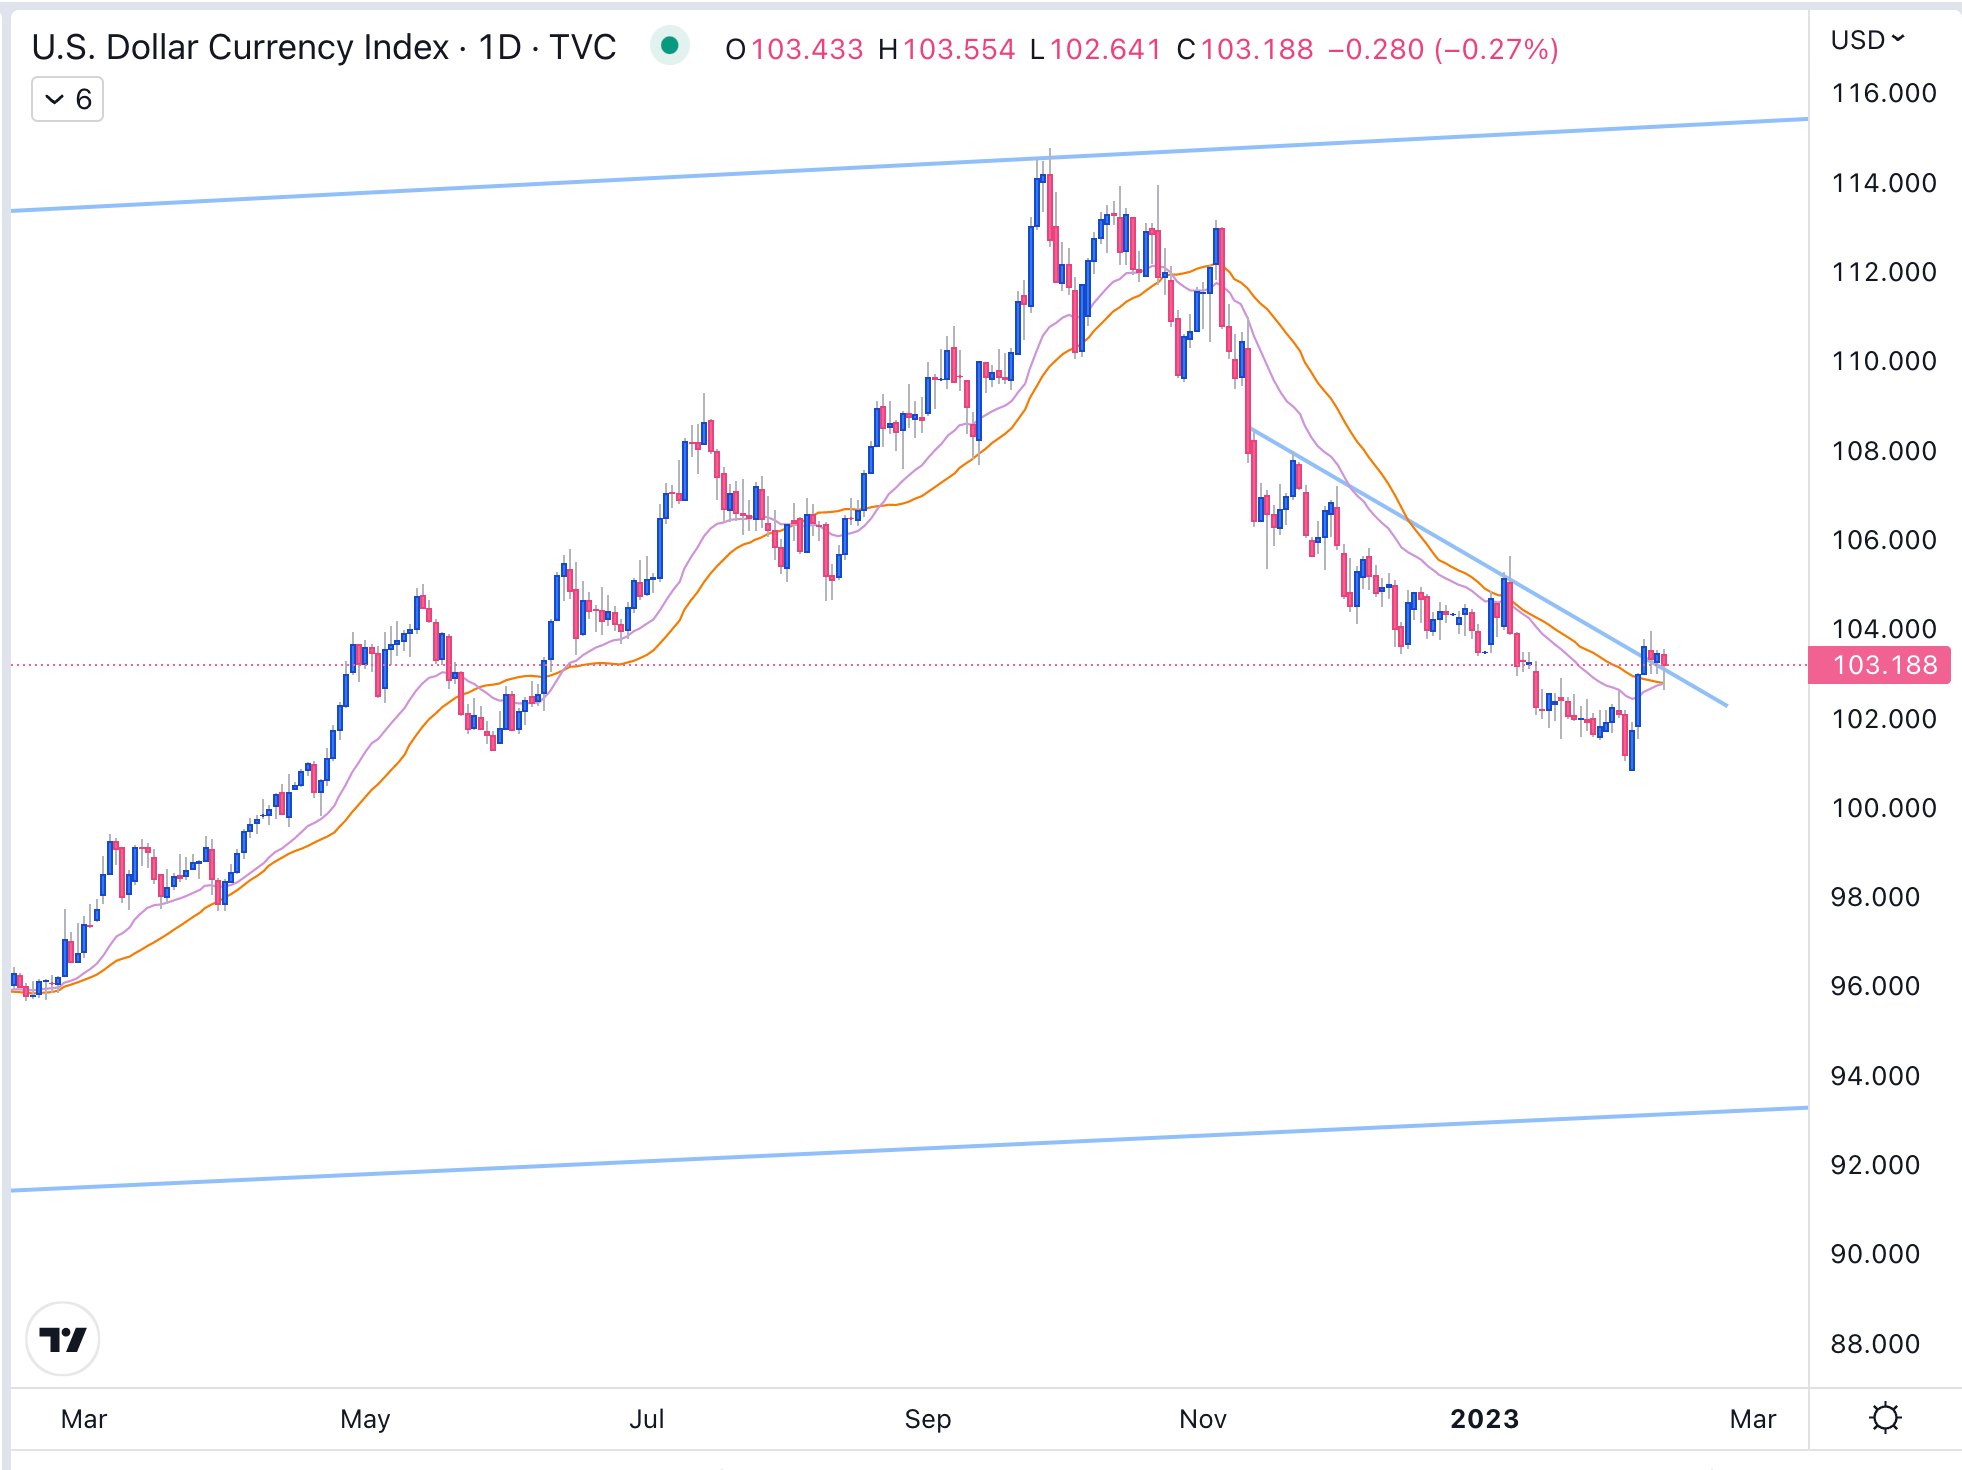
If DXY starts going up above $103, it won't be good for growth stocks in short term.
Meanwhile we would also like to see 20 year bond ETF TLT, keep the strength and stay above its uptrend support line.
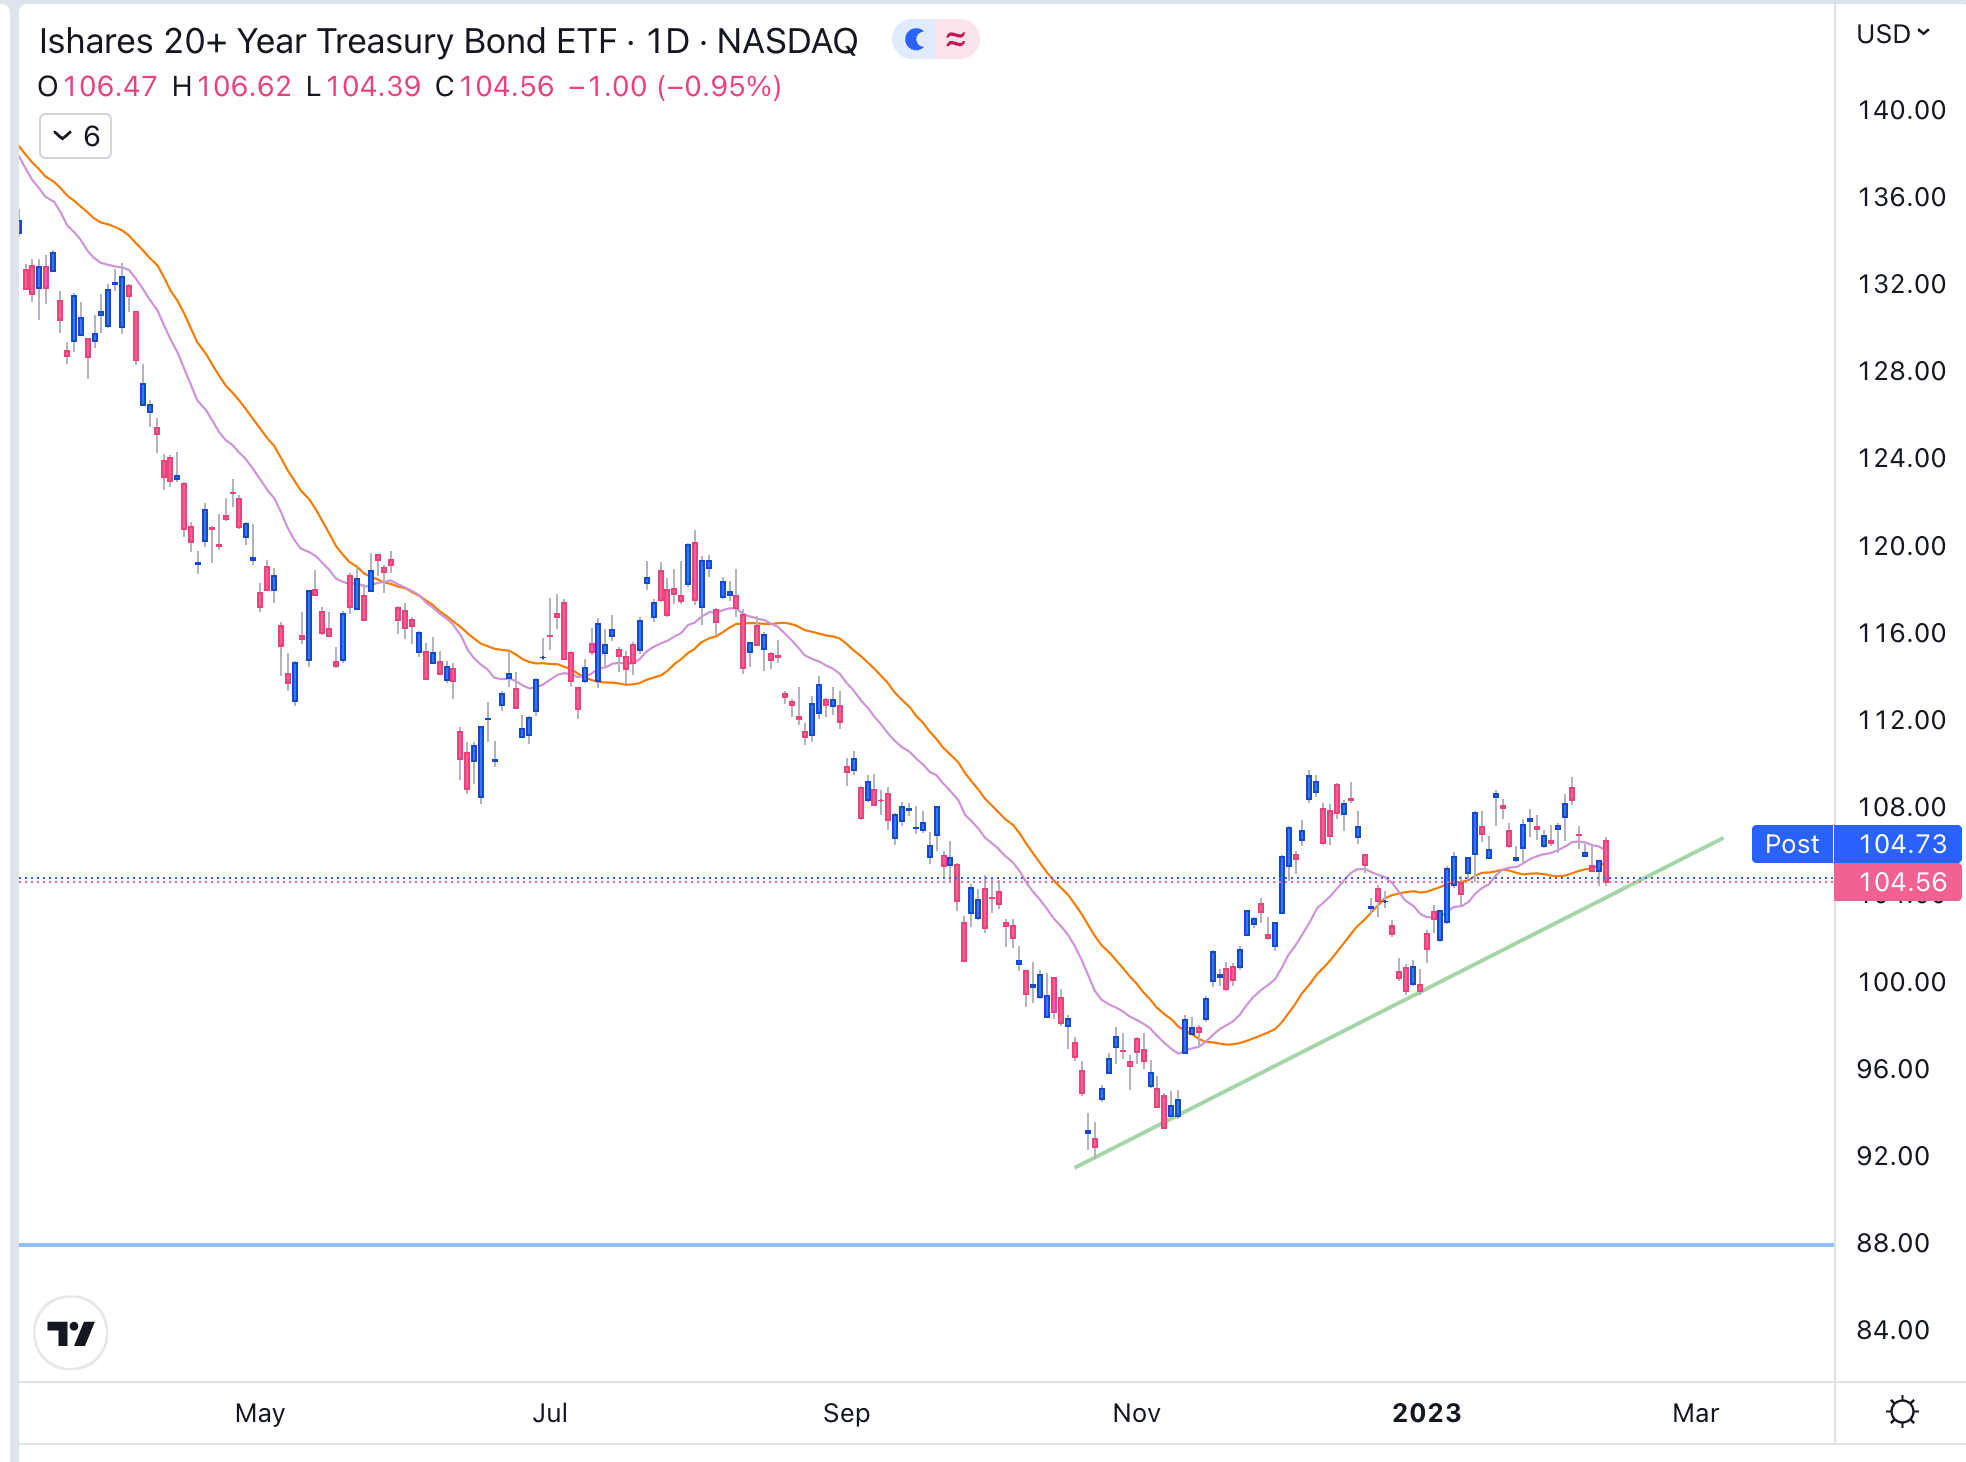
We will keep an eye on these two charts & overall market sector trend. Based on these indicators we will issue new buy alerts in our Portfolio 2023.
10y/2y Interest rate spread is still inverted
The 10-2 Treasury Yield Spread is the difference between the 10 year treasury rate and the 2 year treasury rate.
A 10-2 treasury spread that approaches 0 signifies a "flattening" yield curve. A negative 10-2 yield spread has historically been viewed as a precursor to a recessionary period. A negative 10-2 spread has predicted every recession from 1955 to 2018, but has occurred 6-24 months before the recession occurring, and is thus seen as a far-leading indicator. The 10-2 spread reached a high of 2.91% in 2011, and went as low as -2.41% in 1980.
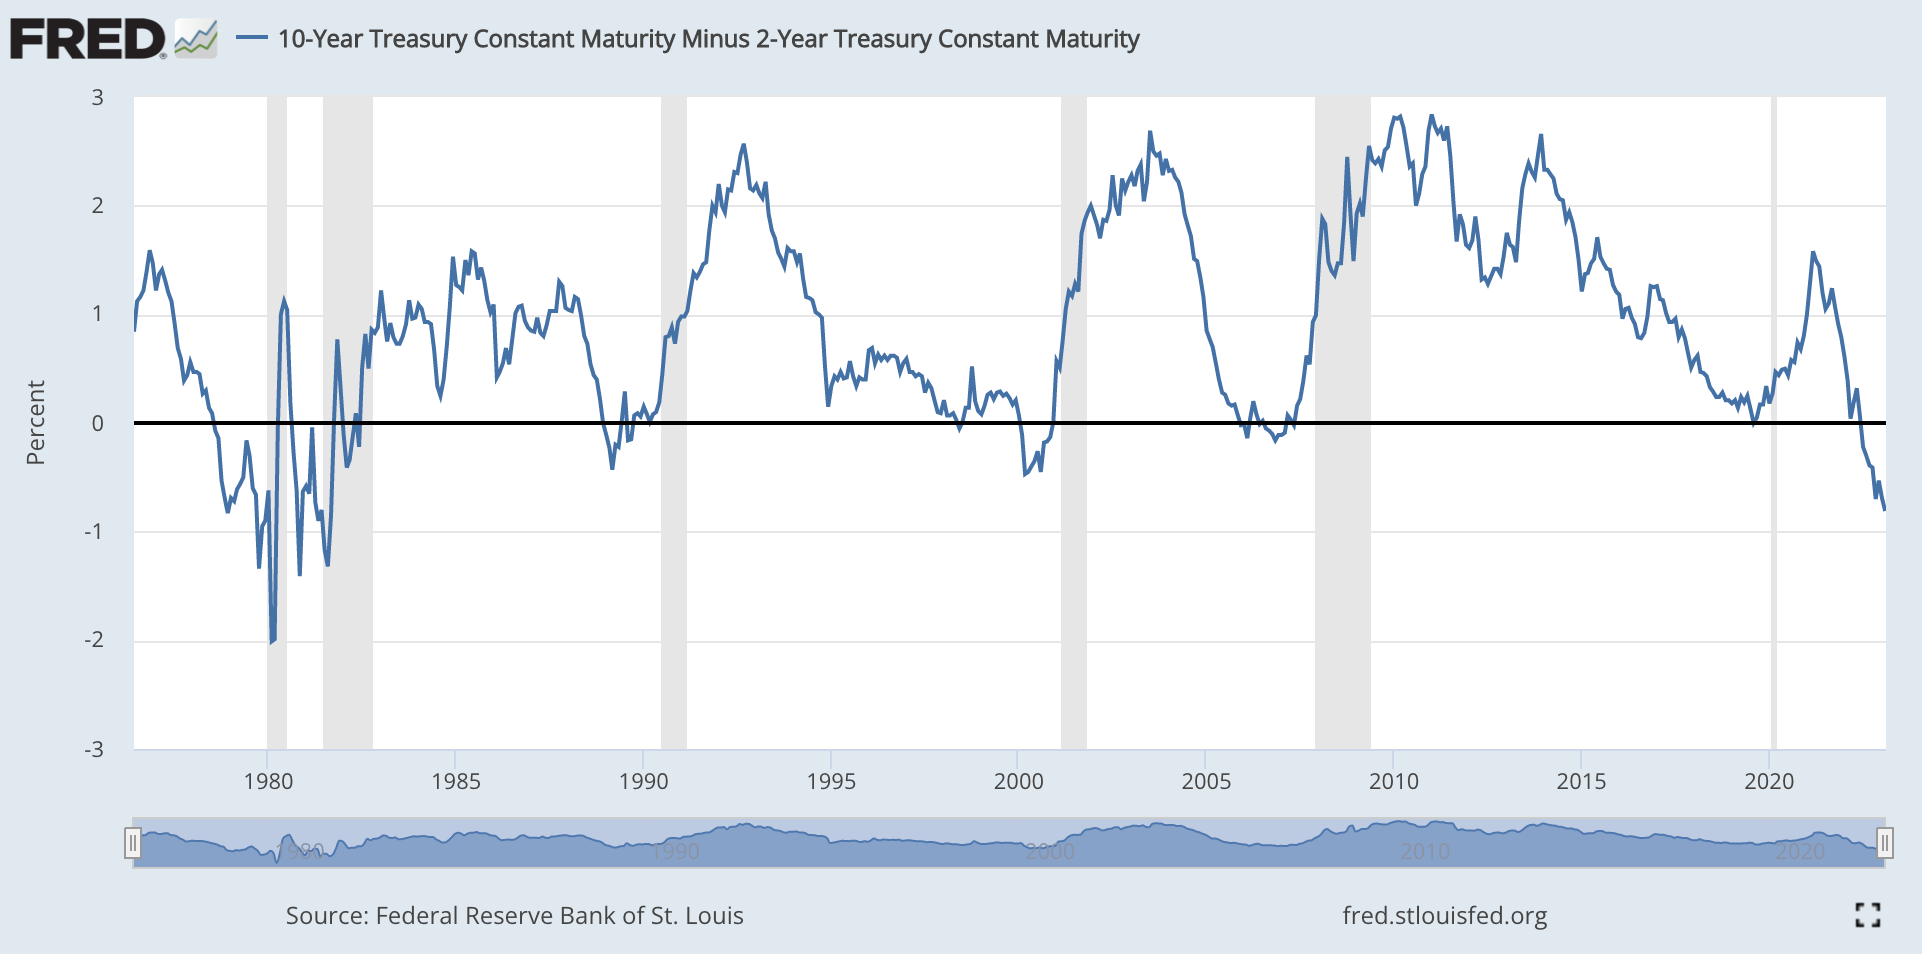
Currently the spread is negative 0.81, which is not good for overall economy and it indicates a pending recession.
We would invest for growth in 2023 and will have to balance our portfolio to add recession proof stocks, as well as stocks that would grow revenue, income for next 10 years.
We do not want to be in the group of investors who become more optimistic when stock prices have risen further.
Please be cautious for another few weeks and do not add too much into the positions which are already overbought.
We did some great additions in Jan in our growth stock portfolio, our Portfolio 2023 is up 20% based on the total value we allotted to each position.
Don't look for instant gratification (instant profits, right after you buy), but try to understand the long term satisfaction of building wealth gradually.
-Alpha Investor